Skip Content
Report on Typhoon Wipha (2506)
Report on Typhoon Wipha (2506)
Figures
Figure 1a: Provisional track of Wipha (2506): 16 – 23 July 2025
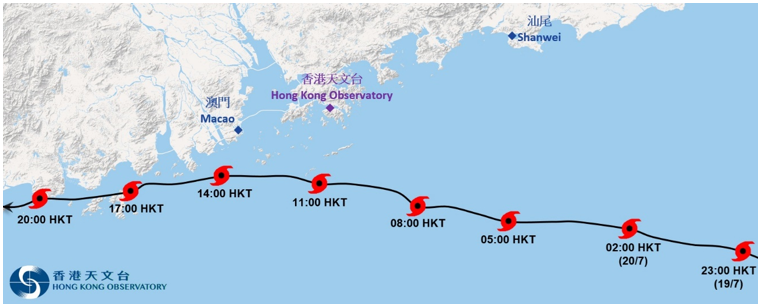
Figure 1b: Provisional track of Wipha (2506) near Hong Kong
Figure 2: Time series of the estimated maximum sustained wind speed near the centre of Wipha (2506): 16 – 23 July 2025 (initial assessment)
Figure 3: Rainfall distribution on 19 – 21 July 2025
Figure 4a: Visible satellite imagery at around 9 a.m. on 20 July 2025
Figure 4b: Infra-red coloured satellite imagery at around 9 a.m. on 20 July 2025
Figure 5a: The overlay image of the radar echoes captured at 9:18 a.m. on 20 July 2025 with the locations of cloud-to-ground lightning recorded between 9:12 a.m. and 9:17 a.m.
Figure 5b: Image of radar echoes captured at 11:00 a.m. on 20 July 2025
Figure 6a: 10-minute mean wind direction and speed recorded at various stations in Hong Kong at 10:00 a.m. on 20 July 2025
Figure 6b: 10-minute mean wind direction and speed recorded at various stations in Hong Kong at 11:35 a.m. on 20 July 2025
Figure 6c: 10-minute mean wind direction and speed recorded at various stations in Hong Kong at 12:15 p.m. on 20 July 2025
Figure 7: Traces of 10-minute mean wind speed recorded at Cheung Chau Beach, Waglan Island and Ngong Ping on 19 – 21 July 2025
Figure 8: Traces of mean sea-level pressure recorded at the Hong Kong Observatory, Cheung Chau and Waglan Island on 19 – 21 July 2025
Figure 9: Traces of sea level and storm surge recorded at Tai Po Kau, Tsim Bei Tsui and Tai Miu Wan on 19 – 21 July 2025
Figure 10: The passage of Wipha resulted in fallen trees in many parts of Hong Kong
Figure 11: During the passage of Wipha, a tree about 10 metres high collapsed in an open car park on Kwong Sin Street in Sha Tin, damaging several vehicles parked nearby
Figure 12: During the passage of Wipha, a 40 m by 10 m exterior scaffolding of a building in North Point collapsed, damaging a number of vehicles parked in the housing estate
Figure 13: During the passage of Wipha, a 100 m by 20 m exterior scaffolding of a car park in North Point collapsed, blocking four traffic lanes
Figure 14: During the passage of Wipha, the roads at Wong Tai Sin and Tai Po were flooded
Figure 15: During the passage of Wipha, a lamppost fell onto Ting Kau Bridge, leading to the closure of all traffic lanes
Figure 16: During the passage of Wipha, farmland facilities in Ta Kwu Ling were blown down, causing damage to crops
Figure 17: During the passage of Wipha, a three-story sightseeing ferry drifted off Kennedy Town and collided with a wharf in wind waves
Tables
Table 1: Maximum gust peak speeds and maximum hourly mean winds with associated wind directions recorded at various stations when the tropical cyclone warning signals for Wipha were in force
Table 2: Maximum 60-minute mean wind speeds and maximum gusts recorded during the passage of Wipha and the tropical cyclones necessitating the issuance of No. 10 signals recently (Hato in 2017, Mangkhut in 2018 and Saola in 2023)
Table 3: Periods during which sustained strong and gale force winds were attained at the eight reference anemometers in the tropical cyclone warning system when tropical cyclone warning signals for Wipha were in force
Table 4: Daily rainfall amounts recorded at the Hong Kong Observatory Headquarters and other stations during the passage of Wipha
Table 5: Times and heights of the maximum sea level and the maximum storm surge recorded at tide stations in Hong Kong during the passage of Wipha