Daily Normal of Meteorological Elements for Hong Kong, September 1981-2010
The below figures represent daily mean values of the weather elements calculated from data
in the 30 years from 1981 to 2010 for the 5-day period centred on the day specified.
in the 30 years from 1981 to 2010 for the 5-day period centred on the day specified.
| Date | Mean Pressure (hPa) Figure |
Air Temperature Figure |
Wet Bulb (deg. C) Figure |
Dew Point (deg. C) Figure |
Relative Humidity (%) Figure |
Mean Daily Rainfall (mm) Figure |
Amount of Cloud (%) Figure |
||
|---|---|---|---|---|---|---|---|---|---|
| Mean Maximum (deg. C) |
Mean (deg. C) |
Mean Minimum (deg. C) |
|||||||
| 1 Sep | 1006.2 | 31.2 | 28.7 | 26.7 | 25.8 | 24.7 | 80 | 10.6 | 67 |
| 2 Sep | 1006.4 | 31.0 | 28.6 | 26.6 | 25.8 | 24.6 | 80 | 11.0 | 68 |
| 3 Sep | 1006.6 | 30.9 | 28.5 | 26.5 | 25.7 | 24.6 | 80 | 10.6 | 68 |
| 4 Sep | 1006.8 | 30.7 | 28.3 | 26.3 | 25.6 | 24.5 | 81 | 10.6 | 70 |
| 5 Sep | 1007.0 | 30.5 | 28.2 | 26.3 | 25.6 | 24.5 | 81 | 11.6 | 70 |
| 6 Sep | 1007.2 | 30.5 | 28.2 | 26.2 | 25.5 | 24.4 | 81 | 11.3 | 69 |
| 7 Sep | 1007.4 | 30.5 | 28.1 | 26.2 | 25.4 | 24.3 | 80 | 12.3 | 68 |
| 8 Sep | 1007.8 | 30.5 | 28.1 | 26.1 | 25.4 | 24.2 | 80 | 12.8 | 67 |
| 9 Sep | 1008.0 | 30.4 | 28.0 | 26.1 | 25.3 | 24.0 | 80 | 11.9 | 65 |
| 10 Sep | 1008.1 | 30.5 | 28.0 | 26.1 | 25.2 | 23.9 | 79 | 10.4 | 65 |
| 11 Sep | 1008.3 | 30.5 | 28.0 | 26.1 | 25.1 | 23.8 | 79 | 11.7 | 63 |
| 12 Sep | 1008.4 | 30.4 | 27.9 | 26.0 | 25.0 | 23.6 | 78 | 13.3 | 64 |
| 13 Sep | 1008.4 | 30.3 | 27.9 | 25.9 | 24.9 | 23.5 | 78 | 14.7 | 64 |
| 14 Sep | 1008.6 | 30.3 | 27.9 | 25.9 | 24.9 | 23.5 | 78 | 17.5 | 64 |
| 15 Sep | 1008.7 | 30.2 | 27.8 | 25.9 | 24.8 | 23.4 | 78 | 18.2 | 64 |
| 16 Sep | 1008.8 | 30.2 | 27.8 | 25.9 | 24.8 | 23.4 | 78 | 15.5 | 66 |
| 17 Sep | 1009.0 | 30.2 | 27.8 | 26.0 | 24.8 | 23.4 | 78 | 12.8 | 66 |
| 18 Sep | 1009.2 | 30.2 | 27.8 | 25.9 | 24.7 | 23.3 | 78 | 10.8 | 65 |
| 19 Sep | 1009.5 | 30.1 | 27.7 | 25.8 | 24.6 | 23.2 | 78 | 9.4 | 66 |
| 20 Sep | 1009.6 | 30.0 | 27.6 | 25.7 | 24.5 | 23.0 | 77 | 8.5 | 66 |
| 21 Sep | 1009.7 | 29.8 | 27.5 | 25.5 | 24.4 | 22.8 | 77 | 9.1 | 66 |
| 22 Sep | 1009.9 | 29.6 | 27.3 | 25.4 | 24.2 | 22.7 | 77 | 8.9 | 67 |
| 23 Sep | 1010.2 | 29.4 | 27.1 | 25.3 | 24.1 | 22.7 | 78 | 9.8 | 67 |
| 24 Sep | 1010.4 | 29.4 | 27.1 | 25.2 | 24.0 | 22.6 | 77 | 8.7 | 66 |
| 25 Sep | 1010.7 | 29.4 | 27.1 | 25.3 | 24.0 | 22.5 | 77 | 8.0 | 65 |
| 26 Sep | 1011.0 | 29.3 | 27.0 | 25.3 | 23.9 | 22.5 | 77 | 7.7 | 64 |
| 27 Sep | 1011.2 | 29.3 | 26.9 | 25.2 | 23.9 | 22.4 | 77 | 8.3 | 63 |
| 28 Sep | 1011.3 | 29.3 | 26.9 | 25.2 | 23.8 | 22.4 | 77 | 6.9 | 64 |
| 29 Sep | 1011.5 | 29.3 | 26.9 | 25.2 | 23.8 | 22.4 | 77 | 5.3 | 64 |
| 30 Sep | 1011.8 | 29.2 | 26.8 | 25.1 | 23.8 | 22.3 | 77 | 5.6 | 64 |
| Observed at | Hong Kong Observatory | ||||||||
| Date | Bright Sunshine Duration (hours) Figure |
Wind Figure |
Sea Temperature Figure |
||
|---|---|---|---|---|---|
| Prevailing Direction (degrees) |
Mean Speed (km/h) |
AM (deg. C) |
PM (deg. C) |
||
| 1 Sep | 6.1 | 090 | 17 | 27.0 | 27.4 |
| 2 Sep | 5.7 | 090 | 18 | 27.0 | 27.4 |
| 3 Sep | 5.7 | 090 | 19 | 27.0 | 27.3 |
| 4 Sep | 5.6 | 090 | 20 | 27.0 | 27.3 |
| 5 Sep | 5.6 | 090 | 21 | 27.0 | 27.3 |
| 6 Sep | 5.7 | 090 | 21 | 26.9 | 27.3 |
| 7 Sep | 5.9 | 090 | 21 | 26.9 | 27.4 |
| 8 Sep | 6.0 | 090 | 21 | 26.9 | 27.4 |
| 9 Sep | 6.0 | 090 | 21 | 26.9 | 27.5 |
| 10 Sep | 6.0 | 080 | 20 | 27.0 | 27.5 |
| 11 Sep | 6.0 | 080 | 20 | 27.1 | 27.5 |
| 12 Sep | 5.8 | 080 | 21 | 27.0 | 27.5 |
| 13 Sep | 5.6 | 080 | 21 | 27.1 | 27.5 |
| 14 Sep | 5.6 | 080 | 21 | 27.1 | 27.5 |
| 15 Sep | 5.7 | 090 | 22 | 27.2 | 27.5 |
| 16 Sep | 5.6 | 090 | 22 | 27.2 | 27.6 |
| 17 Sep | 5.7 | 090 | 22 | 27.3 | 27.6 |
| 18 Sep | 5.8 | 090 | 22 | 27.3 | 27.7 |
| 19 Sep | 5.8 | 090 | 23 | 27.3 | 27.6 |
| 20 Sep | 5.7 | 090 | 23 | 27.3 | 27.6 |
| 21 Sep | 5.6 | 090 | 23 | 27.3 | 27.6 |
| 22 Sep | 5.4 | 090 | 25 | 27.3 | 27.5 |
| 23 Sep | 5.3 | 080 | 26 | 27.2 | 27.5 |
| 24 Sep | 5.5 | 080 | 27 | 27.2 | 27.5 |
| 25 Sep | 5.7 | 080 | 27 | 27.1 | 27.5 |
| 26 Sep | 5.8 | 080 | 27 | 27.1 | 27.5 |
| 27 Sep | 6.0 | 090 | 27 | 27.1 | 27.5 |
| 28 Sep | 6.0 | 090 | 26 | 27.1 | 27.5 |
| 29 Sep | 5.9 | 080 | 26 | 27.1 | 27.6 |
| 30 Sep | 5.6 | 080 | 27 | 27.2 | 27.5 |
| Observed at | King's Park | Waglan Island | North Point | ||
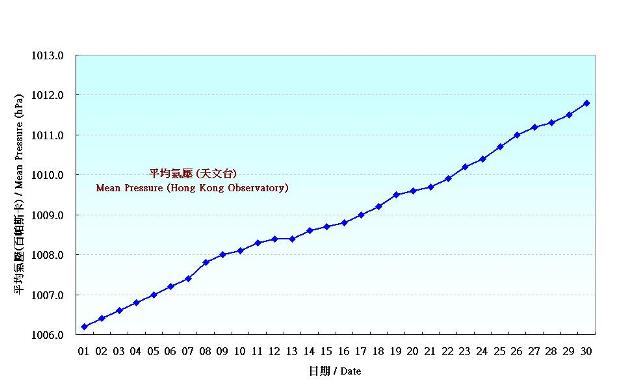
Figure 1. Daily Normals mean pressure at September (1981-2010)
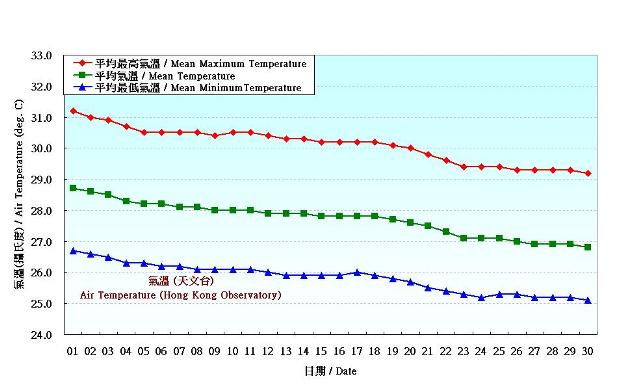
Figure 2. Daily Normals air temperature at September (1981-2010)
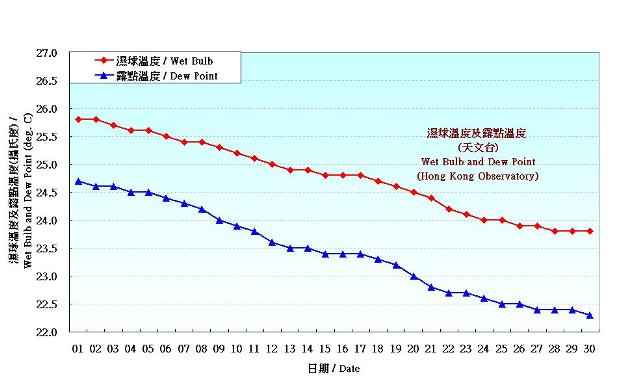
Figure 3. Daily Normals wet-bulb temperature and dew point temperature at September (1981-2010)
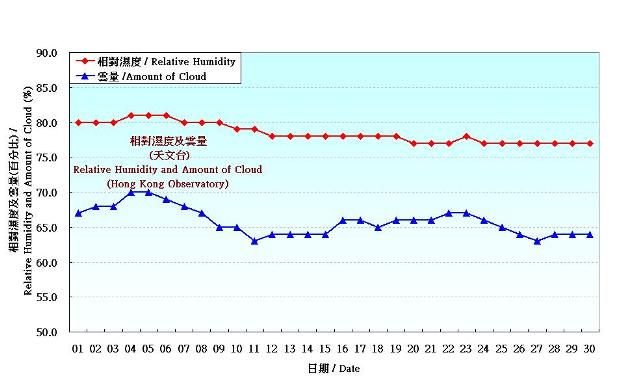
Figure 4. Daily Normals relative humdity at September (1981-2010)
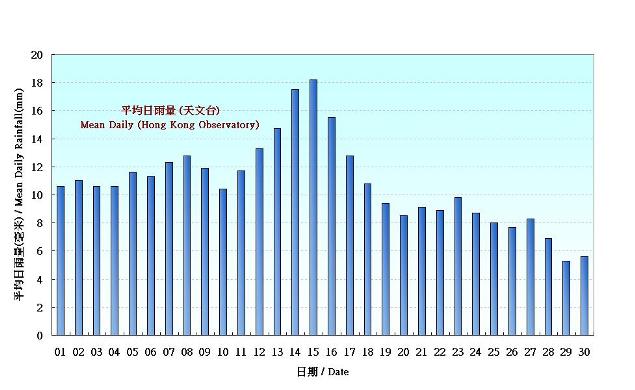
Figure 5. Daily Normals mean daily rainfall at September (1981-2010)
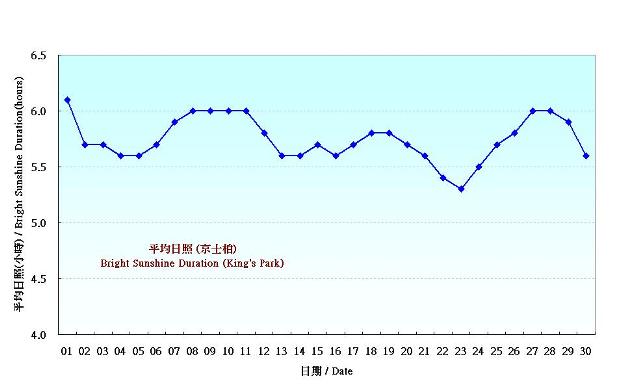
Figure 6. Daily Normals mean daily Bright Sunshine Duration at September (1981-2010)
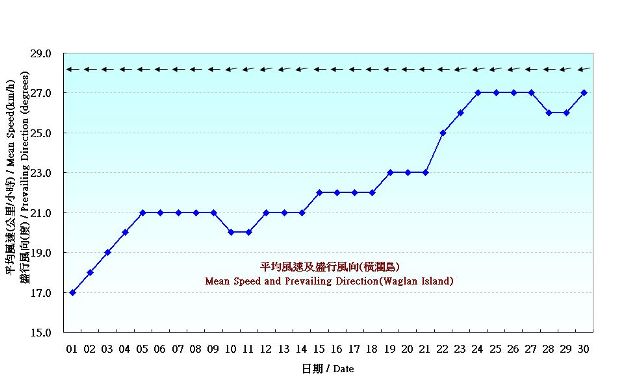
Figure 7. Daily Normals mean wind at September (1981-2010)
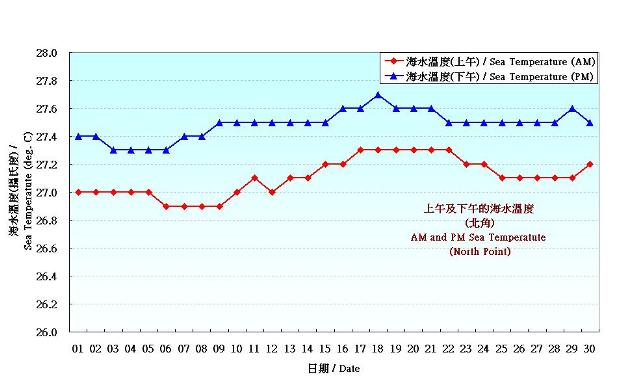
Figure 8. Daily Normals mean sea temperature at September (1981-2010)