Skip Content
Report on Severe Tropical Storm Tapah (2516)
Report on Severe Tropical Storm Tapah (2516)
Figures
Figure 1a: Provisional track of Tapah (2516): 5 – 9 September 2025
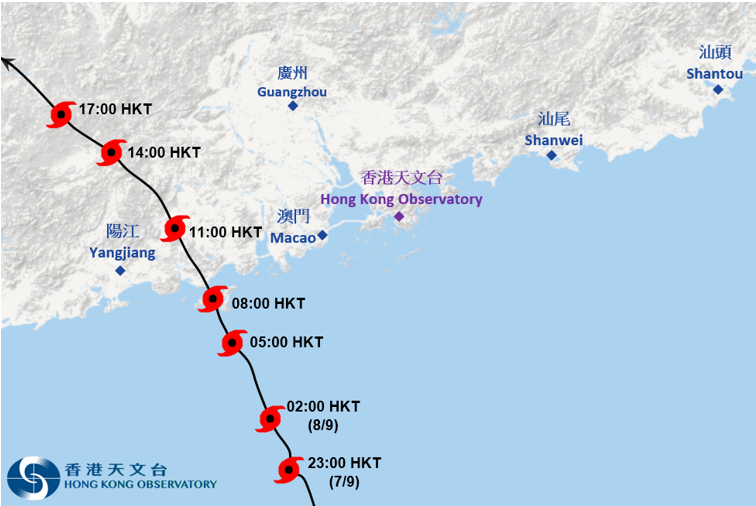
Figure 1b: Provisional track of Tapah (2516) near Hong Kong
Figure 2: Rainfall distribution on 5 – 9 September 2025
Figure 3a: 10-minute mean wind direction and speed recorded at various stations in Hong Kong at 8:30 a.m. on 8 September 2025
Figure 3b: 10-minute mean wind direction and speed recorded at various stations in Hong Kong at 9:00 a.m. on 8 September 2025
Figure 4: Traces of 10-minute mean wind speed recorded at Cheung Chau, Sai Kung and Hong Kong International Airport on 7 – 9 September 2025
Figure 5: Traces of sea level and storm surge recorded at Tsim Bei Tsui on 7 – 9 September 2025
Figure 6a: Infra-red satellite imagery at around 2 a.m. on 8 September 2025
Figure 6b: Infra-red coloured satellite imagery at around 2 a.m. on 8 September 2025
Figure 7a: The overlay image of the radar echoes captured at 1:06 a.m. on 8 September 2025 with the locations of cloud-to-ground lightning recorded between 1:00 a.m. and 1:05 a.m.
Figure 7b: Radar echoes captured at 8:00 a.m. on 8 September 2025
Figure 8: A large tree fell on Pok Fu Lam Road, blocking several traffic lanes
Figure 9: A private car was hit by a water pipe while driving on Kai Fuk Road in Kowloon Bay, and its windshield shattered
Figure 10: The pedestrian subway from Choi Yuen Estate/Choi Po Court to Fan Kam Road was flooded
Tables
Table 1: Maximum gust peak speeds and maximum hourly mean winds with associated wind directions recorded at various stations when the tropical cyclone warning signals for Tapah were in force
Table 2: Periods during which sustained strong and gale force winds were attained at the eight reference anemometers in the tropical cyclone warning system when tropical cyclone warning signals for Tapah were in force
Table 3: Daily rainfall amounts recorded at the Hong Kong Observatory Headquarters and other stations during the passage of Tapah
Table 4: Times and heights of the maximum sea level and the maximum storm surge recorded at tide stations in Hong Kong during the passage of Tapah