Hong Kong Regional Weather Information Portal
Notes of Products
- The data displayed is provisional. Only limited data validation has been carried out.
- The temperature and relative humidity displayed on this webpage are instantaneous readings, while the temperature and relative humidity in the hourly bulletin "Local Weather Report" are manually taken by weather observers during a ten-minute period before the end of each hour. Since the measurement times of the two may differ, the two readings may not be the same.
- Please note that the photographs are captured by webcams automatically and are compressed onsite before transmitted to the Hong Kong Observatory Headquarters. Due to limited image resolution and possible effect of environmental factors other than weather on image quality, these photographs should be used for reference only.
- The numerical Hong Kong Heat Index reading above represents the average of readings in the 10 minutes ending at the indicated time.
- The Hong Kong Heat Index was calculated from the measured Natural Wet Bulb Temperature (Tnw), Globe Temperature (Tg) and Dry Bulb Temperature (Ta). Its value is given by 0.80Tnw + 0.05Tg + 0.15Ta. Generally speaking, the public should take appropriate precautions when the index at King’s Park reaches around 30 or above to prevent from adverse health effects brought by hot weather. Reference : K.L. Lee, Y.H. Chan , T.C. Lee, William B. Goggins & Emily Y.Y. Chan, The development of the Hong Kong Heat Index for enhancing the heat stress information service of the Hong Kong Observatory, International Journal of Biometeorology, DOI 10.1007/s00484-015-1094-7, November 2015.
- To maintain data reliability, the heat stress monitoring station will undergo brief maintenance and consumable replenishment every few weeks. Data updates may be temporarily suspended at that time.
- The data displayed is provisional. Only limited data validation has been carried out.
- This webpage displays the grass temperature for the period 5 p.m. to 8 a.m. the following day. It is updated every 10 minutes.
- The grass temperature for the period 8 a.m. to 5 p.m. is not displayed. The measurement may not truly reflect the grass temperature due to direct exposure of the sensor to the sun.
- The measurement may not truly reflect the grass temperature in the presence of frost.
- The data displayed is provisional. Only limited data validation has been carried out.
- The Observatory has set up backup weather stations and anemometers in some areas. When the main weather stations or anemometers in those areas are under maintenance, the webpage will display data from the backup stations or anemometers.
- The Chek Lap Kok wind station is located near the middle of the North Runway of the Hong Kong International Airport. When this station is under maintenance, wind data of Chek Lap Kok may be temporarily provided by another wind station within the Hong Kong International Airport.
- The data displayed is provisional. Only limited data validation has been carried out.
- The numerical visibility reading above represents the average of readings in the 10 minutes ending at the indicated time.
- The visibility at Chek Lap Kok is provided by the visibility meter near the middle of the south runway of the Hong Kong International Airport. When this visibility meter cannot provide data, the visibility value will come from one of the neighbouring meters at the airport.
- The reported visibility ranges between 100 metres and 50 kilometres. A visibility report of 100 metres refers to visibilities of 100 metres or less. A visibility report of 50 kilometres refer to visibilities of 50 kilometres or more.
- The data displayed is provisional. Only limited data validation has been carried out.
- According to World Meteorological Organization guidelines, based on different ranges, visibility is rounded down to the nearest: 100 metres (for visibility: 100 metres to 4,999 metres), 1 kilometre (for visibility: 5 kilometres to 30 kilometres), or 5 kilometres (for visibility: 31 kilometres to 50 kilometres).
- The data displayed is provisional. Only limited data validation has been carried out.
- The rainfall distribution map (isohyet chart) serves only to indicate visually the spatial pattern of rain. It should not be relied upon to derive exact rainfall amounts at specific locations. Furthermore, this is an automated product generated by computer for quick reference, erroneous data may slip through quality checks in spite of the best of our intentions.
- For a brief background information and interpretation of the isohyet chart, please click here
- The image shows the rainfall rate at a height of 3 km above mean sea level, as observed by Hong Kong Observatory's weather radar.
- The image updates once every 6 minutes.
- Weather radar detects rain in the atmosphere by measuring the intensity of signals reflected from raindrops. This signal intensity depends on a number of factors. Generally speaking, the larger the raindrops are and the more their amount is, the stronger is the reflected signal.
- An empirical formula is used to convert the signal intensity into rainfall rate. Thus, the rainfall rate presented here is only an estimate. Furthermore, the rainfall rate refers to the 3-km level, so that the rainfall reaching ground could be very different.
- Weather radar may occasionally pick up reflected signals from sources other than rain, such as reflections from clouds, trees, buildings, birds, hills, sea waves and even distant land mass. Please exercise care when viewing the image, as these signals may occasionally show up on the radar image.
- The time of the radar image represents the time when the radar completes its scans.
- The lightning records are updated at 5-minute intervals.
- The data displayed is provisional. Only limited data validation has been carried out.
Adopt the forecast products of The Automatic Regional Weather Forecast (ARWF) website, including:
- Hourly forecasts of air temperature, relative humidity and wind direction and speed for the next nine days at the stations in Hong Kong;
- Hourly forecasts of the weather icons for the stations in Hong Kong, as well as an overview of the state-of-sky for each day over the next nine days;
- Daily forecasts of the probability of precipitation at the stations in Hong Kong for the next nine days;
- Rainfall nowcast for the next two hours over Hong Kong and the Pearl River Delta Region; and
- Lightning nowcast for the next hour over Hong Kong and the Pearl River Delta Region (beta);
- The products are updated twice a day at around noon and midnight. The former provides hourly forecasts from noon the same day to midnight on the ninth day. The latter provides hourly forecasts from midnight the same day to midnight on the ninth day.
- The products are generated using a multi-model consensus forecast system, which integrates the outputs of a number of global numerical weather prediction (NWP) models. The model outputs are first corrected based on the observation data collected at various weather stations over Hong Kong and the Pearl River Delta. A consensus forecast is then derived by combining the corrected model forecasts weighted according to their past performance. Technical details of the forecast system are available from the Hong Kong Observatory Article No. 1064.
- Users can view the forecast time series of a particular station by clicking on the map directly.
-
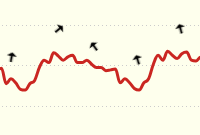
In the time series chart for wind speed, the arrow represents the hourly forecast wind direction. "←" and "↓" indicate easterly and northerly winds respectively.
- The forecast for certain stations may sometimes be not available due to missing observation or forecast data. In this case, an "M" will be displayed.
-
The weather icon describes both the cloud cover and the rainfall expected each day or over the corresponding 3-hour period. Details are listed in the table below:
WEATHER ICON 


CAPTION Sunny Sunny Periods Sunny Intervals Sunny Periods with A Few Showers Sunny Intervals with Showers WEATHER ICON 


CAPTION Cloudy Light Rain
(0.5 mm or above)Moderate rain or heavier
(10 mm or more)WEATHER ICON 


CAPTION Fine
(use only in night-time on 1st of the Lunar Month)Fine
(use only in night-time on 2nd to 6th of the Lunar Month)Fine
(use only in night-time during 7th to 13th of Lunar Month)Fine
(use only in night-time during 14th to 17th of Lunar Month)Fine
(use only in night-time during 18th to 24th of Lunar Month)Fine
(use only in night-time during 25th to 30th of Lunar Month)WEATHER ICON 


CAPTION Mainly Fine
(use only in night-time on 1st of the Lunar Month)Mainly Fine
(use only in night-time on 2nd to 6th of the Lunar Month)Mainly Fine
(use only in night-time during 7th to 13th of Lunar Month)Mainly Fine
(use only in night-time during 14th to 17th of Lunar Month)Mainly Fine
(use only in night-time during 18th to 24th of Lunar Month)Mainly Fine
(use only in night-time during 25th to 30th of Lunar Month)WEATHER ICON 


CAPTION Mainly Cloudy
(use only in night-time on 1st of the Lunar Month)Mainly Cloudy
(use only in night-time on 2nd to 6th of the Lunar Month)Mainly Cloudy
(use only in night-time during 7th to 13th of Lunar Month)Mainly Cloudy
(use only in night-time during 14th to 17th of Lunar Month)Mainly Cloudy
(use only in night-time during 18th to 24th of Lunar Month)Mainly Cloudy
(use only in night-time during 25th to 30th of Lunar Month) - The daily forecast of the probability of precipitation (PoP) indicates the chance of rain (with rainfall of 0.5 mm or more) at the station on a certain day and it has six categories: <10%, 20%, 40%, 60%, 80% and >90%.
- For example, if PoP is 60%, it means that the probability of rain occurrence at the station is around 60% on that day. In other words, rain occurs about 60 times on average in every 100 forecasts, with the error of around 10 times on average from the actual number of occurrence according to the verification statistics. It should be noted that PoP only indicates how likely there will be rain, and it is not directly related to the size of area affected by rain, the time of rain occurrence, its duration or intensity.
- As the products integrate the outputs of a number of NWP models, errors in individual NWP model forecasts will limit the capability of the products in predicting extreme weather events.
- The above products are directly generated from a computer forecast system without manual adjustments. The individual element weather forecast given in a station includes at most the forecast information of weather, temperature, relative humidity as well as wind direction and speed, subject to the available observations of that station. The forecast may be different from the official weather forecasts issued by the Observatory or the measurements recorded at individual weather stations. Please refer to the official forecasts issued by the Observatory.
- For more information on numerical weather prediction, probabilistic forecasting and other meteorological topics, please visit:
-
The rainfall forecasts are generated by the Hong Kong Observatory's nowcasting system SWIRLS (Short-range Warning of Intense Rainstorms in Localized Systems). The main inputs of SWIRLS include the radar echoes (the reflected radar signals from raindrops) collected by the Observatory's weather radars, as well as the rainfall records registered at local raingauges. Simply stated, four main steps are involved in rainfall nowcasting, namely
- tracking of the radar echoes
- the real-time calibration and conversion of radar echoes into rainfall rate
- the extrapolation in time of the radar-derived rainfall (assuming that both the rainfall rate and movement of echoes remain unchanged); and
- computation of the accumulated rainfall amount at the surface grid
- The horizontal resolution of the grid used to generate the rainfall forecast product is 2 kilometres. The areal coverage of the product is from 21.328 to 23.487 degrees North and 112.956 to 115.291 degrees East (i.e. within about 120 kilometres of Hong Kong) (black boundary box on map). Under normal operating conditions, the forecast rainfall maps are updated automatically once every 6 minutes, following the completion of the radar scans starting at the 00th, 06th, 12th, 18th, 24th, 30th, 36th, 42nd, 48th and 54th minute of every hour. Normally, it takes 20 minutes or so to finish the processes of radar scanning, computation in SWIRLS, graphics generation and web page upload to the Internet. A total of 16 forecast distribution maps of 30-minute rainfall accumulation will be disseminated in every update to show the corresponding evolution in 6-minute steps.
- In reality, rainstorms can develop very rapidly. Significant strengthening or weakening, or even changes in the direction and speed of storm movement may occur between successive updates of the product. Should such developments happen, the assumptions of the invariability of rainfall rate and storm movement will be violated, resulting in large forecast errors.
- The colour of each pixel in the rainfall forecast maps merely represents the average rainfall amount expected to fall on the respective 2 by 2 square kilometers grid box. In other words, the sub-grid rainfall distribution is not resolved.
-
When a specific station is selected,following icons expresses the change of forecast rainfall of that station every 30 minutes.
ICON 


CAPTION Half-hourly accumulated rainfall less than 2.5 mm Half-hourly accumulated rainfall between 2.5 and 5 mm Half-hourly accumulated rainfall more than 5 mm - The rainfall records given in the ordinary weather reports are based on data collected by surface rain gauges. Such records are relevant to specific locations only and are different from the above-mentioned forecast rainfall over a gird box (which are essential areal averages). Direct comparison between the two cannot be made.
- The Observatory will consider a number of factors when issuing weather warnings associated with rainstorms, including the current and forecast intensity of the rainstorms, their coverage and how long they will last, etc. Besides, those factors that are not taken into account in the nowcast system, such as atmospheric stability and influence of the atmospheric circulation would also be considered. In short, the forecast rainfall amount derived from the nowcast system is only one of the many factors that have to be considered.
- Due to the above limitations, the rainfall forecast maps and time series may be different from the weather information disseminated by the Hong Kong Observatory and the neighbouring meteorological authorities. Users should not assess the likelihood of a rainstorm warning based on the products directly. For taking precautionary actions against inclement weather, the public is reminded to refer to the latest weather forecasts and warnings issued by the Hong Kong Observatory and the respective meteorological services in Guangdong and Macao as the authoritative sources:
- The lightning forecasts are generated by the Hong Kong Observatory's nowcasting system SWIRLS (Short-range Warning of Intense Rainstorms in Localized Systems). Reference on the technical details of SWIRLS can be found in section 1 of “2-hour Rainfall Nowcast” above.
- The horizontal resolution of the grid used to generate the rainfall forecast product is approximately 700 metres. The areal coverage of the product is from 22.0 to 22.7 degrees North and 113.7 to 114.6 degrees East (red boundary box on map). Under normal operating conditions, the forecast rainfall maps are updated automatically once every 3 minutes. Normally, it takes 20 minutes or so to finish the processes of radar scanning, computation in SWIRLS, graphics generation and web page upload to the Internet. A total of 10 forecast distribution maps of lightning will be disseminated in every update to show the corresponding evolution in 6-minute steps.
- Thunderstorms can develop very rapidly. Significant intensification or weakening, or even changes in the direction and speed of storm movement may occur within the forecast period resulting in forecast errors. This is a limitation of the current state of science and technology in weather forecasting.
- Red boxes on the forecast lightning map indicate forecast lightning locations corresponding to the selected time on the time slider.
-
When a specific station is selected,lightning icons indicate whether there will be lightning within the designated 30-minute period of forecast. A red lightning icon indicates lightning within 10 km, while an amber icon indicates lightning within 15 km. Icons for the second 30-minute forecast period are depicted with hollow shapes to indicate lower certainty of forecast.
ICON 


CAPTION Lightning within 10 km in the first 30-minute period Lightning within 15 km in the first 30-minute period Lightning within 10 km in the second 30-minute period Lightning within 15 km in the second 30-minute period - Based on verification result, the probability of detection within 15 kilometres in the first 30-minute period is around 70%. The forecast accuracy is lower for the second 30-minute period.
- The forecast weather condition as presented by this web page may be different from other weather information disseminated by the Observatory for the general public. The user should not assess the likelihood of rainstorm or other warnings based on the lightning forecast information directly. To take precautionary actions against inclement weather, the public is reminded to refer to the weather warnings special weather tips, and the latest local weather forecasts issued by the Hong Kong Observatory.