Skip Content
Report on Typhoon Toraji (2423)
Report on Typhoon Toraji (2423)
Figures
Figure 1a: Provisional track of Toraji (2423): 9 - 15 November 2024
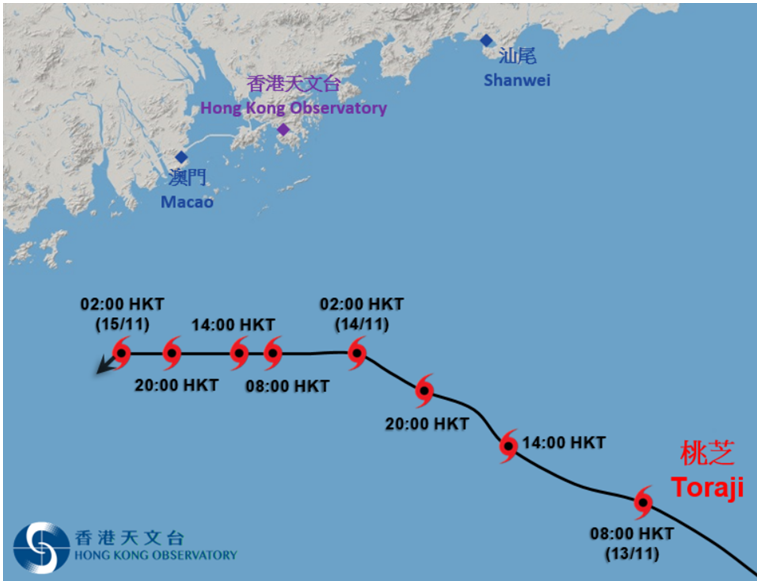
Figure 1b: Provisional track of Toraji (2423) near Hong Kong
Figure 2: Rainfall distribution on 11 – 15 November 2024
Figure 3: 10-minute mean wind direction and speed recorded at various stations in Hong Kong at 2:30 a.m. on 14 November 2024
Figure 4: Traces of 10-minute mean wind speed recorded at Waglan Island, Ngong Ping and Cheung Chau Beach on 13 – 15 November 2024
Figure 5: Infra-red satellite imagery at around 8 a.m. on 11 November 2024
Figure 6: Radar imagery showing the Doppler velocity at around 7:42 p.m. on 13 November 2024
Figure 7: Radar echoes captured at 6 a.m. on 14 November 2024
Tables
Table 1: Maximum gust peak speeds and maximum hourly mean winds with associated wind directions recorded at various stations when the tropical cyclone warning signals for Toraji were in force
Table 2: Periods during which sustained strong and gale force winds were attained at the eight reference anemometers in the tropical cyclone warning system when tropical cyclone warning signals for Toraji were in force
Table 3: Daily rainfall amounts recorded at the Hong Kong Observatory Headquarters and other stations during the passage of Toraji
Table 4: Times and heights of the maximum sea level and the maximum storm surge recorded at tide stations in Hong Kong during the passage of Toraji