Phased Array Weather Radar and Low Altitude Weather
Phased Array Weather Radar and Low Altitude Weather
LAU Tsz-ki and CHAN Ying-wa
January 2025
The Observatory installed a Phased Array Weather Radar (PAWR) at Sha Lo Wan (SLW) in 2021. After more than three years of operation, the PAWR has been proven effective in detecting high impact severe weather in Hong Kong [1]. This lays a solid science foundation for the future establishment of a PAWR network covering the entire Hong Kong.
The merit of PAWR lies in its ability to provide high spatiotemporal resolution radar images. Compared with the long-range weather radars at Tai Mo Shan and Tate’s Cairn, PAWR takes one-sixth of the time and five times the resolution to complete a volume scan of the atmosphere[*], enabling effective capture of rapidly changing inclement weather events such as tornadoes, hail, intense thunderstorms and the associated severe gusts. Two weather cases from 2024 which illustrate the operational benefits of PAWR are described in the following sections.
A trough of low pressure brought heavy showers and thunderstorms to Guangdong on 30 April 2024. At around 9 p.m. that night, a band of intense thundery showers affected the western coast of the Pearl River Estuary and brought hail to the regions near Macao. As the band of thundery showers moved eastwards and approached the western part of Hong Kong, the vertical cross-section of hydrometeor classification product from the SLW PAWR at about 9:19 p.m. showed the presence of hail below 5 km (Figure 1). The Observatory also issued a message in the Thunderstorm Warning indicating the possibility of hail affecting Hong Kong.
A waterspout was observed inside the Victoria Harbour at around 12:30 p.m. on 28 September 2024 (Figure 2, left). This was the first waterspout report inside the Victoria Harbour since 1959. The Doppler velocity field from the SLW PAWR around that time showed the dipole feature [2] associated with the waterspout (Figure 2, right), indicating the presence of a cyclonic vortex. The Observatory further utilised radar data from the SLW PAWR and the long-range weather radar at Tate’s Cairn to produce 3-dimensional wind fields associated with the waterspout based on the dual-Doppler wind retrieval method [3,4] (Figure 3), enhancing the understanding of the structure and characteristics of the waterspout.
As the SLW PAWR is installed at a relatively low altitude location (radar antenna height of around 35 metres above sea level), radar scanning can be carried out for low-altitude airspace as low as a few hundred metres, enhancing significantly the Observatory’s capability in monitoring weather conditions at low altitudes, including low-level precipitation and variations of wind fields. As shown from the waterspout case above, dual-Doppler wind retrieval can be conducted by using radar data from the SLW PAWR and other long-range weather radars to generate high resolution 3-dimensional wind fields. This enables the Observatory to provide meteorological information for low-altitude vehicles such as drones, small aircraft and other low-level carriers, ensuring flight safety at low-altitudes and facilitating development of low-altitude economy.
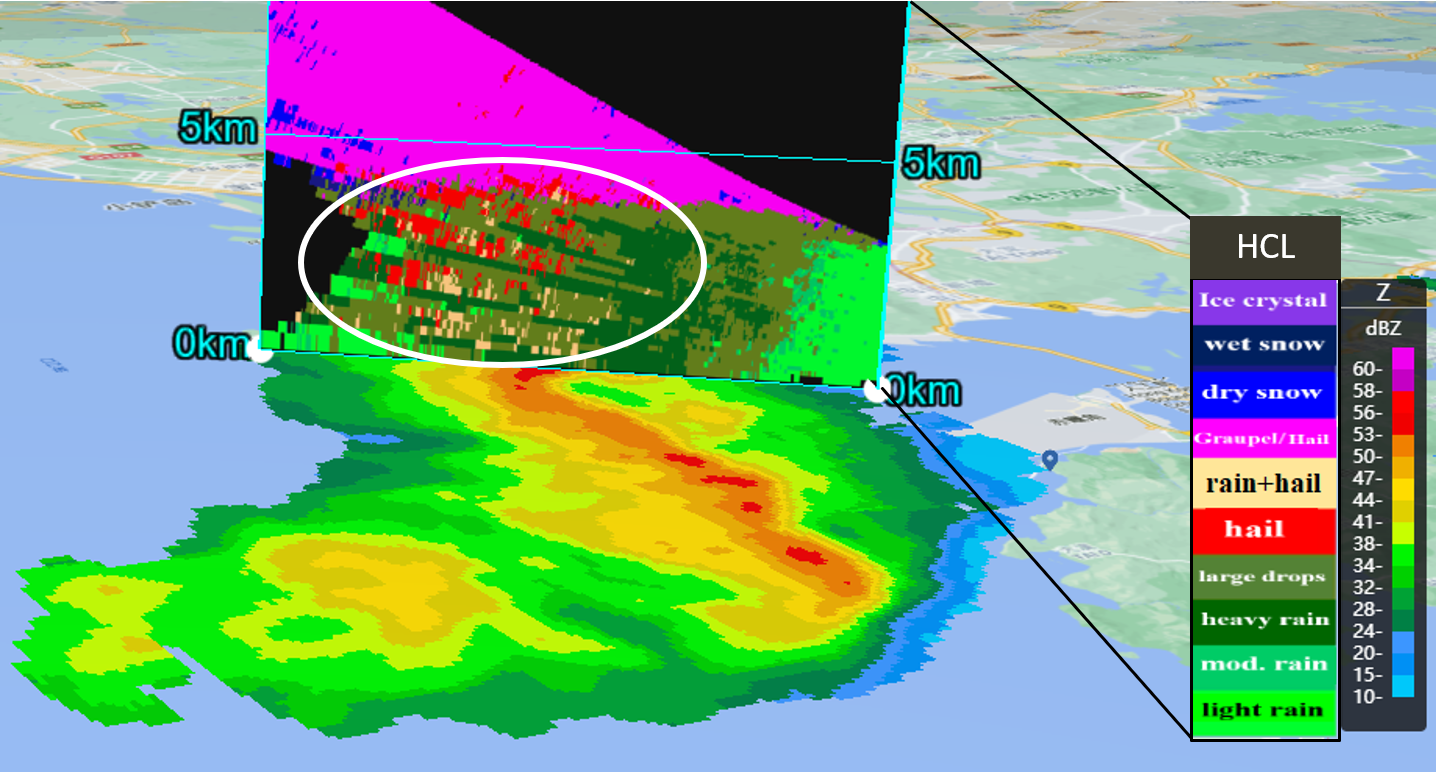
Figure 1 The vertical cross-section of hydrometeor classification product from the SLW PAWR at around 9:19 p.m. on 30 April 2024 showed the presence of hail below 5 kilometres (red dots inside the white ellipse).
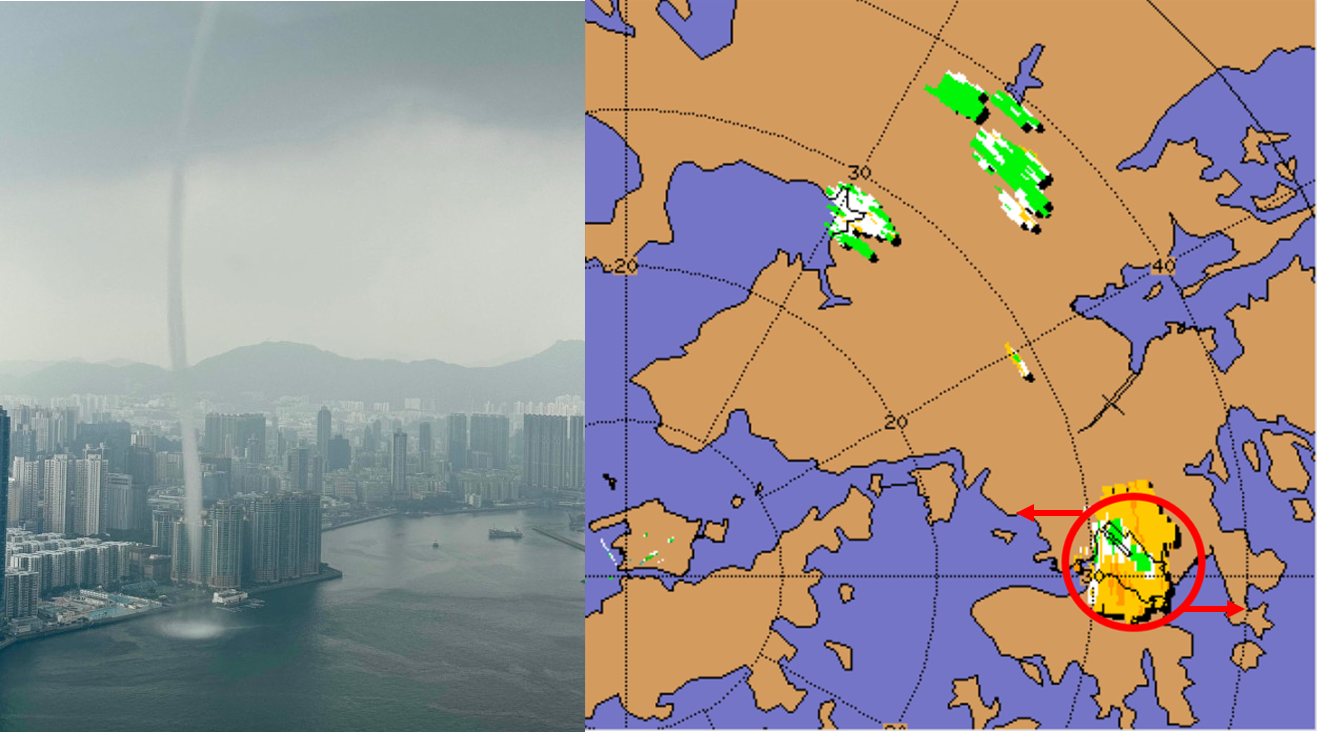
Figure 2 Left: The waterspout observed within the Victoria Harbour at around 12:30 p.m. on 28 September 2024 (Courtesy of the Government Flying Service). Right: The Doppler velocity field from the SLW PAWR around that time showed the dipole feature associated with the waterspout (green: towards the radar; orange: away from the radar).
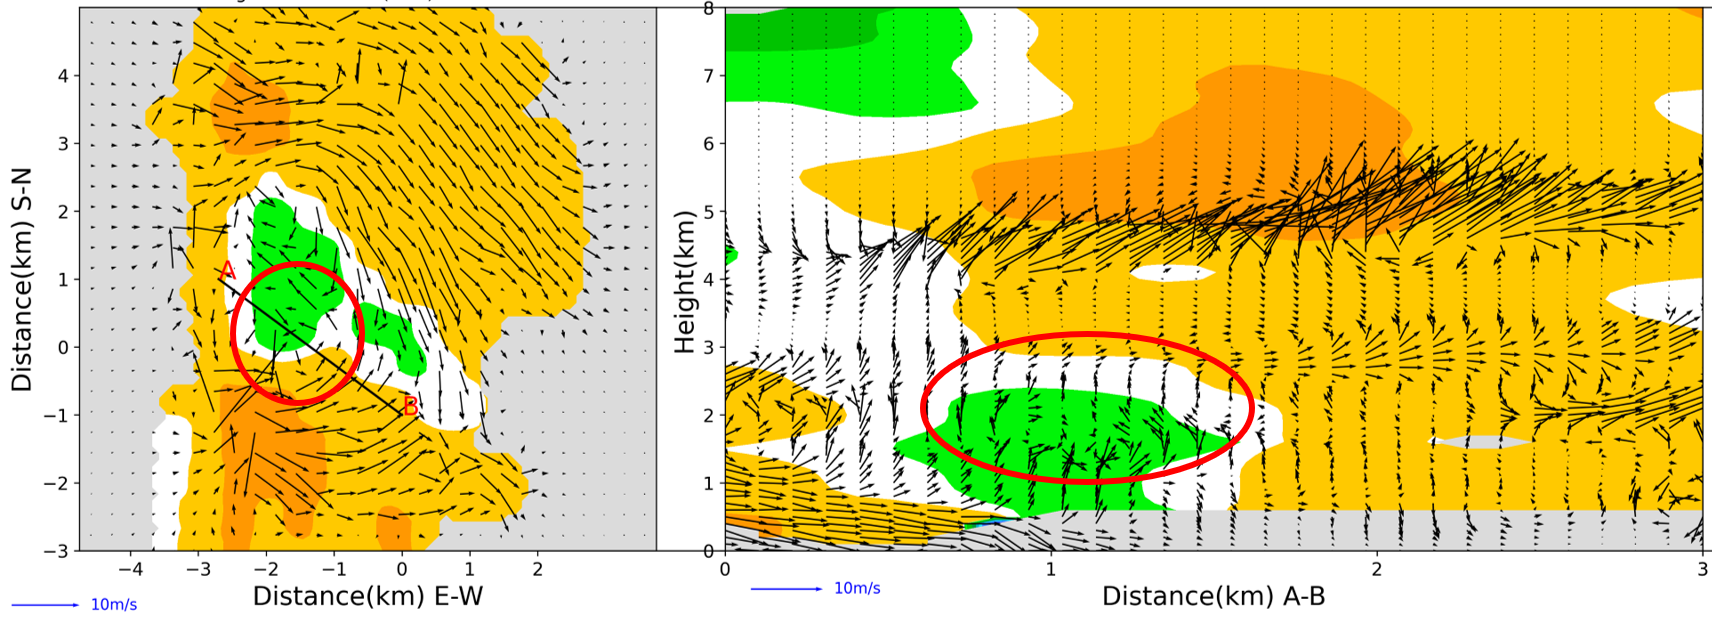
Figure 3 3-dimensional wind fields retrieved using radar data from the SLW PAWR and Tate’s Cairn weather radar at around 12:30 p.m. on 28 September 2024. Left: Horizontal wind velocity field at about 1,435 metres above mean sea level overlaid with the SLW PAWR Doppler velocity image (Cyclonic flow is highlighted by the red circle). Right: The vertical cross-section along the black line A-B in the left panel (Updrafts corresponding to the cyclonic flow are indicated by the red ellipse).
Note:
[*] The SLW PAWR can complete a volume scan in one minute with up to 68 layers, providing a fine spatial resolution of radar images down to 30 metres. Compared with the two existing long-range Doppler weather radars at Tai Mo Shan and Tate’s Cairn, each of which takes 6 minutes to complete a volume scan with only 12 layers and a spatial resolution of 150 metres.
[*] The SLW PAWR can complete a volume scan in one minute with up to 68 layers, providing a fine spatial resolution of radar images down to 30 metres. Compared with the two existing long-range Doppler weather radars at Tai Mo Shan and Tate’s Cairn, each of which takes 6 minutes to complete a volume scan with only 12 layers and a spatial resolution of 150 metres.
References:
[1] Application of Phased Array Weather Radar (PAWR) in Monitoring Inclement Weather
[2] How to Interpret Velocity Field from Doppler Weather Radar
[3] Application of three-dimensional wind fields and dual-polarisation signals of an X-band Phased Array Weather Radar in diagnosing vertical motion and cloud electrification of convective storms.
[4] A Variational Method for the Analysis of Three-Dimensional Wind Fields from Two Doppler Radars.