How to Interpret Velocity Field from Doppler Weather Radar
How to Interpret Velocity Field from Doppler Weather Radar
TSE Shuk-mei
January 2019
The article "Weather Radar Observations in Hong Kong" in the educational resources of the Hong Kong Observatory (HKO) website briefly introduces the use of the Doppler principle to detect the approaching (or departing) speed of raindrops. As the raindrops are carried by winds, the speed so detected provides a good estimate of the wind speed. One must however bear in mind that this speed is the component of the wind velocity vector along the radar beam direction and is known as radial velocity (Figure 1). If the wind is parallel to the radar beam, the magnitude of the radial velocity is the same as that of the true velocity. If the wind is perpendicular to the radar beam, the radial velocity is then zero. The line with constant zero radial velocity is called the zero isodop.
By using the radial velocity patterns of radar images, interesting phenomena such as the presence of vortices and the wind distribution of a typhoon etc., can be identified. Figure 2 shows the radial velocity patterns for a cyclonic vortex developing at different directions from the radar. The main feature is a dipole pattern, or "wind couplet" , with winds moving away from the radar (positive, warm colour) to right of the zero isodop (grey) and winds moving towards the radar (negative, cold colour) to left of the zero isodop when viewing away from the radar (centre).
The Observatory's Terminal Doppler Radar (BP TDWR) at Brothers Point captured the presence of a waterspout that developed near Ma Wan on the morning of 29 August 2018. After formation, the waterspout moved northwards and approached the Ting Kau Bridge before dissipating near Ting Kau (Figure 3). The radial velocity images based on BP TDWR's scans at elevation 17.0° taken at 11:26 a.m. and 11:31 a.m. on that day are shown in Figure 4. The red circles in Figures 4(a) and (b) show a dipole wind structure with northeasterly winds (blue arrows indicating winds blowing towards the radar) and southwesterly winds (red arrows indicating winds blowing away from the radar) forming a "wind couplet" that suggests a cyclonic rotation of air.
In Hong Kong, waterspouts usually occur during the rainy season from May to October. However, they are usually rather short-lived and the dimensions are very small. Moreover, being situated at the hill top sites, it is difficult for Tai Mo Shan (around 970 m above mean sea level (msl)) and Tate's Cairn (around 580 m above msl) weather radars to observe such low-level meteorological phenomenon. For example, for the event on 29 August 2018, it was assessed that the waterspout occurred at a level below 600 m based on Figure 3 and the Observatory's cloud base observations at the Hong Kong International Airport at 11:30 a.m. that day. As the BP TDWR is situated at a lower height (less than 100 m above msl) and with higher data resolution, the BP TDWR can capture the waterspout on that day.
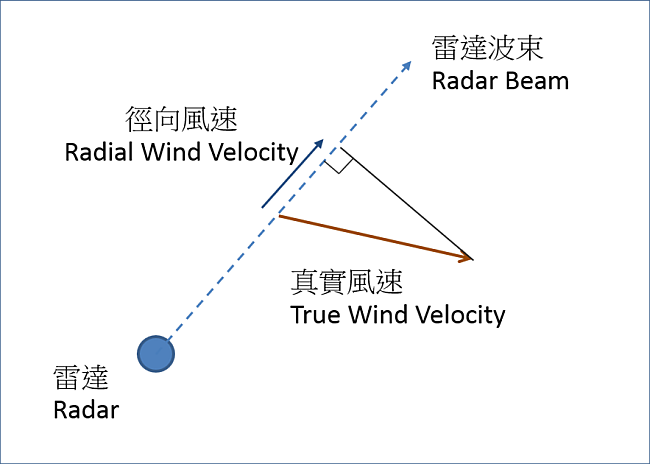
Figure 1 The relationship between radar beam orientation, true wind velocity and radial wind velocity.
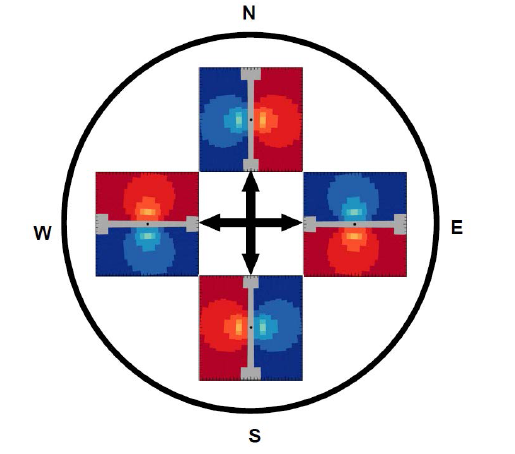
Figure 2 The radial velocity patterns associated with a cyclonic vortex developing at the east, south, west and north directions from the radar. Blue (red) areas indicate winds blowing towards (away from) the radar. (Source: National Severe Storms Laboratory (NSSL) of the U.S. National Oceanic and Atmospheric Administration (NOAA)).
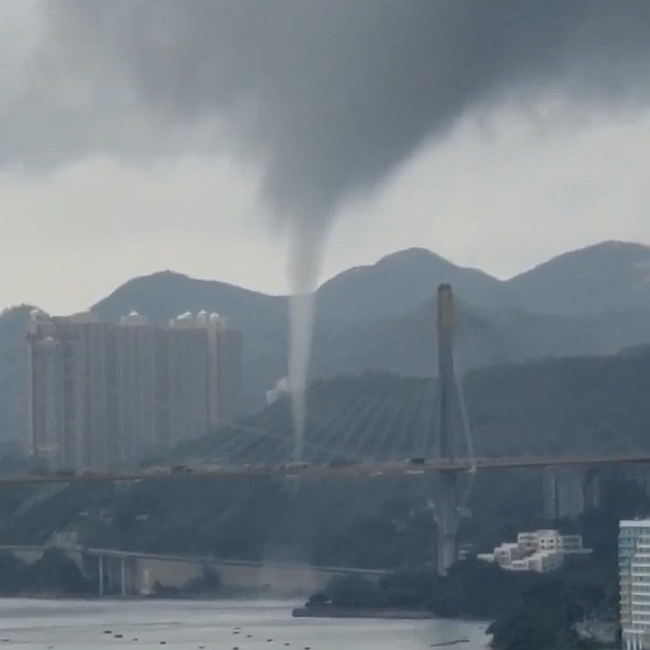
Figure 3 Photo showing a waterspout approaching the Ting Kau Bridge on 29 August 2018 (Courtesy of Tobias Chan).
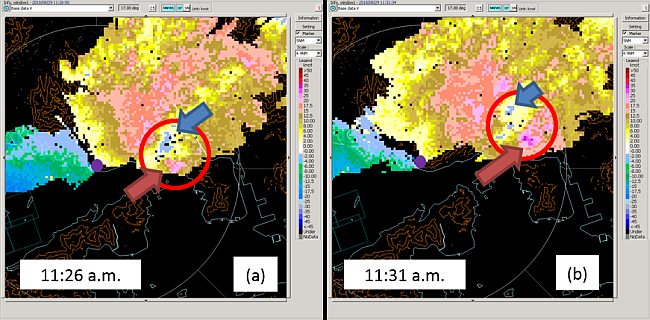
Figure 4 The plan position indicator (PPI) radial velocity images at an elevation angle of 17.0° captured by the Observatory's Brothers Point Terminal Doppler Weather Radar (BP TDRW, purple circle) at 11:26 a.m. and 11:31 a.m. on 29 August 2018. The red circle shows where winds were blowing in opposite directions (blue and red arrows indicating winds blowing towards and away from the radar respectively) and suggesting the presence of a rotating air column.
References:
[1] NWS Training Portal – Radar & Applications Course (Velocity Interpretation), NWS/NOAA
[2] R. Brown & V, Wood, "A Guide to Interpreting Doppler Velocity Patterns", NOAA/NSSL
[3] CK So, "Anomalous appearance of a hole and concentric rings in weather radar images", HKO's website
[1] NWS Training Portal – Radar & Applications Course (Velocity Interpretation), NWS/NOAA
[2] R. Brown & V, Wood, "A Guide to Interpreting Doppler Velocity Patterns", NOAA/NSSL
[3] CK So, "Anomalous appearance of a hole and concentric rings in weather radar images", HKO's website