Mean sea level projection data for Hong Kong
Mean sea level projection data for Hong Kong |
||
|
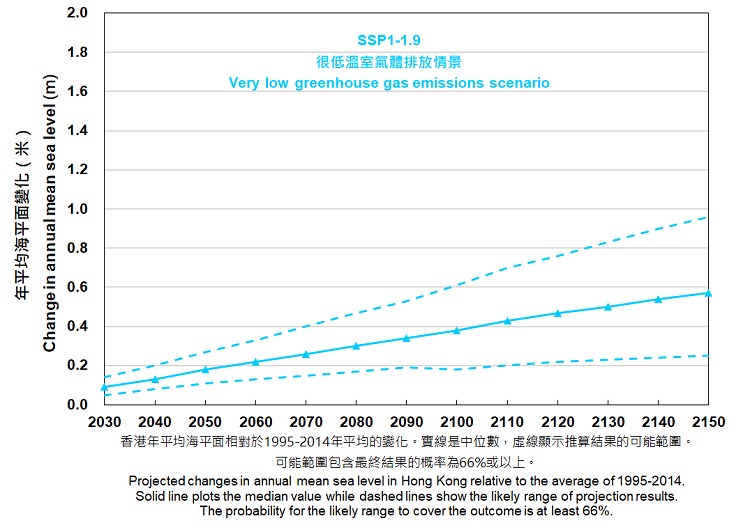
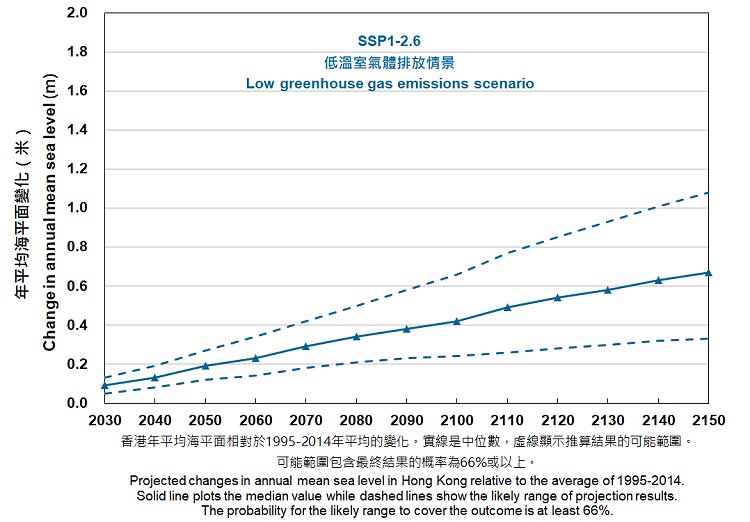
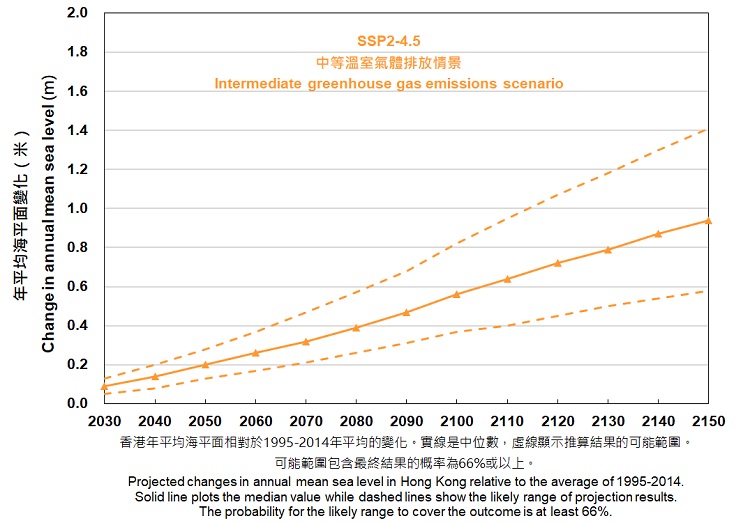
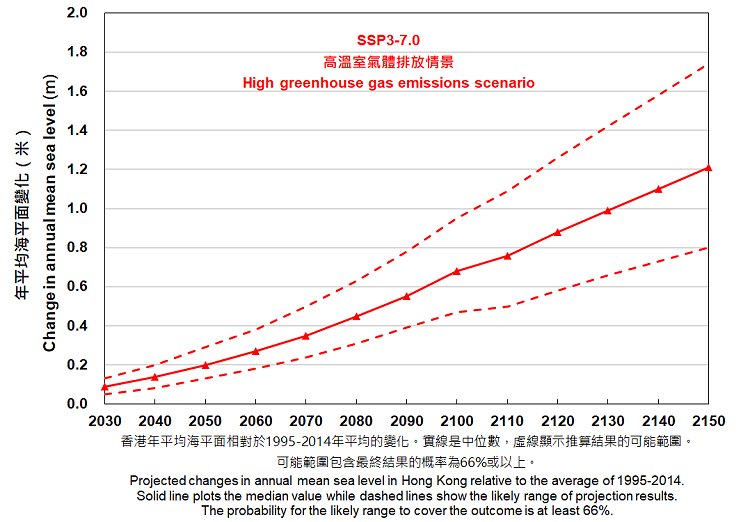
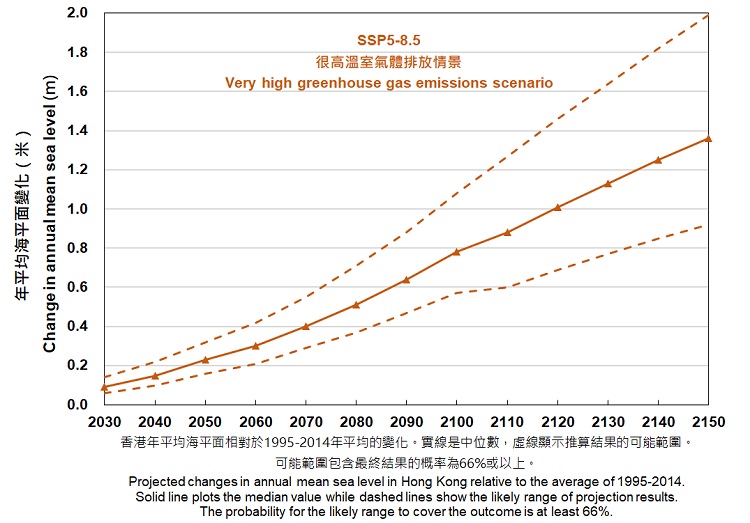
The following table shows projected changes in annual mean sea level in Hong Kong (reference location: Quarry Bay) relative to the average of 1995-2014 under different greenhouse gas emissions scenarios. Average annual mean sea level at Quarry Bay during 1995-2014 is 1.45 m above Hong Kong Chart Datum. The probability for the likely range to cover the outcome is at least 66%.
Data source:
- Fox-Kemper, B., H. T. Hewitt, C. Xiao, G. Aðalgeirsdóttir, S. S. Drijfhout, T. L. Edwards, N. R. Golledge, M. Hemer, R. E. Kopp, G. Krinner, A. Mix, D. Notz, S. Nowicki, I. S. Nurhati, L. Ruiz, J-B. Sallée, A. B. A. Slangen, Y. Yu, 2021, Ocean, Cryosphere and Sea Level Change. In: Climate Change 2021: The Physical Science Basis. Contribution of Working Group I to the Sixth Assessment Report of the Intergovernmental Panel on Climate Change [Masson-Delmotte, V., P. Zhai, A. Pirani, S. L. Connors, C. Péan, S. Berger, N. Caud, Y. Chen, L. Goldfarb, M. I. Gomis, M. Huang, K. Leitzell, E. Lonnoy, J. B. R. Matthews, T. K. Maycock, T. Waterfield, O. Yelekçi, R. Yu and B. Zhou (eds.)]. Cambridge University Press. In press.
- Garner, G. G., R. E. Kopp, T. Hermans, A. B. A. Slangen, G. Koubbe, M. Turilli, S. Jha, T. L. Edwards, A. Levermann, S. Nowikci, M. D. Palmer, C. Smith, in prep. Framework for Assessing Changes To Sea-level (FACTS). Geoscientific Model Development.
- Garner, G. G., T. Hermans, R. E. Kopp, A. B. A. Slangen, T. L. Edwards, A. Levermann, S. Nowikci, M. D. Palmer, C. Smith, B. Fox-Kemper, H. T. Hewitt, C. Xiao, G. Aðalgeirsdóttir, S. S. Drijfhout, T. L. Edwards, N. R. Golledge, M. Hemer, R. E. Kopp, G. Krinner, A. Mix, D. Notz, S. Nowicki, I. S. Nurhati, L. Ruiz, J-B. Sallée, Y. Yu, L. Hua, T. Palmer, B. Pearson, 2021. IPCC AR6 Sea-Level Rise Projections. Version 20210809. PO.DAAC, CA, USA. Dataset accessed [2021-08-24] at https://podaac.jpl.nasa.gov/announcements/2021-08-09-Sea-level-projections-from-the-IPCC-6th-Assessment-Report.
- We thank the projection authors for developing and making the sea-level rise projections available, multiple funding agencies for supporting the development of the projections, and the NASA Sea-Level Change Team for developing and hosting the IPCC AR6 Sea-Level Projection Tool.