Mean sea level projection data (low confidence scenarios) for Hong Kong
Mean sea level projection data (low confidence scenarios) for Hong Kong |
||
|
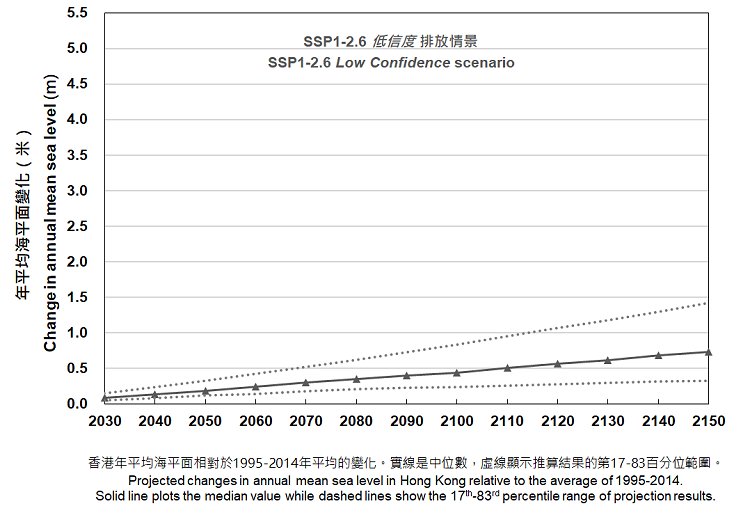
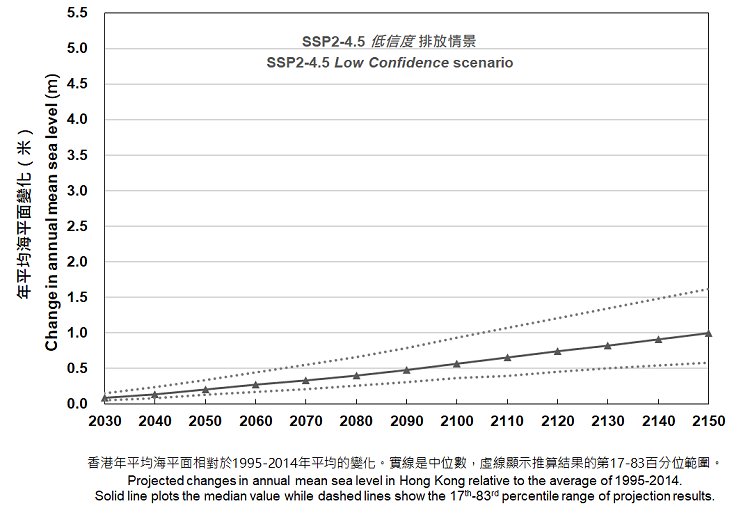
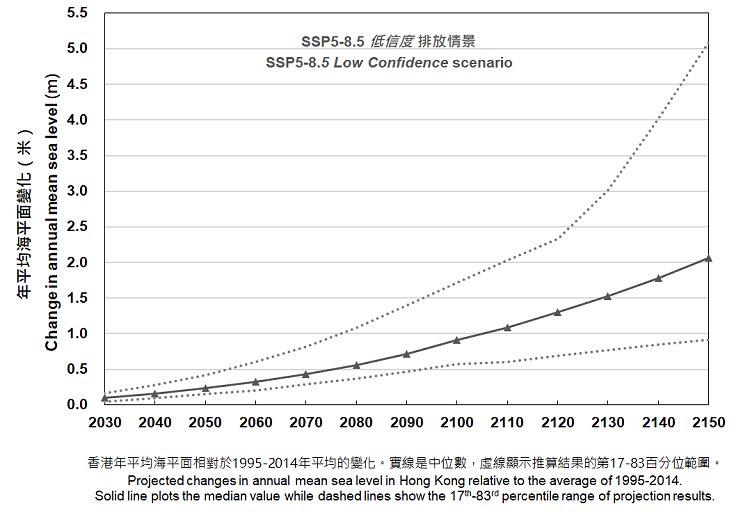
To indicate the potential impact of deeply uncertain ice sheet processes, low confidence scenarios are also considered by IPCC. The following table shows projected changes in annual mean sea level in Hong Kong (reference location: Quarry Bay) relative to the average of 1995-2014 under different low confidence scenarios. Average annual mean sea level at Quarry Bay during 1995-2014 is 1.45 m above Hong Kong Chart Datum.
Data source:
- Fox-Kemper, B., H. T. Hewitt, C. Xiao, G. Aðalgeirsdóttir, S. S. Drijfhout, T. L. Edwards, N. R. Golledge, M. Hemer, R. E. Kopp, G. Krinner, A. Mix, D. Notz, S. Nowicki, I. S. Nurhati, L. Ruiz, J-B. Sallée, A. B. A. Slangen, Y. Yu, 2021, Ocean, Cryosphere and Sea Level Change. In: Climate Change 2021: The Physical Science Basis. Contribution of Working Group I to the Sixth Assessment Report of the Intergovernmental Panel on Climate Change [Masson-Delmotte, V., P. Zhai, A. Pirani, S. L. Connors, C. Péan, S. Berger, N. Caud, Y. Chen, L. Goldfarb, M. I. Gomis, M. Huang, K. Leitzell, E. Lonnoy, J. B. R. Matthews, T. K. Maycock, T. Waterfield, O. Yelekçi, R. Yu and B. Zhou (eds.)]. Cambridge University Press. In press.
- Garner, G. G., R. E. Kopp, T. Hermans, A. B. A. Slangen, G. Koubbe, M. Turilli, S. Jha, T. L. Edwards, A. Levermann, S. Nowikci, M. D. Palmer, C. Smith, in prep. Framework for Assessing Changes To Sea-level (FACTS). Geoscientific Model Development.
- Garner, G. G., T. Hermans, R. E. Kopp, A. B. A. Slangen, T. L. Edwards, A. Levermann, S. Nowikci, M. D. Palmer, C. Smith, B. Fox-Kemper, H. T. Hewitt, C. Xiao, G. Aðalgeirsdóttir, S. S. Drijfhout, T. L. Edwards, N. R. Golledge, M. Hemer, R. E. Kopp, G. Krinner, A. Mix, D. Notz, S. Nowicki, I. S. Nurhati, L. Ruiz, J-B. Sallée, Y. Yu, L. Hua, T. Palmer, B. Pearson, 2021. IPCC AR6 Sea-Level Rise Projections. Version 20210809. PO.DAAC, CA, USA. Dataset accessed [2021-08-24] at https://podaac.jpl.nasa.gov/announcements/2021-08-09-Sea-level-projections-from-the-IPCC-6th-Assessment-Report.
- We thank the projection authors for developing and making the sea-level rise projections available, multiple funding agencies for supporting the development of the projections, and the NASA Sea-Level Change Team for developing and hosting the IPCC AR6 Sea-Level Projection Tool.