The Weather of January 2019
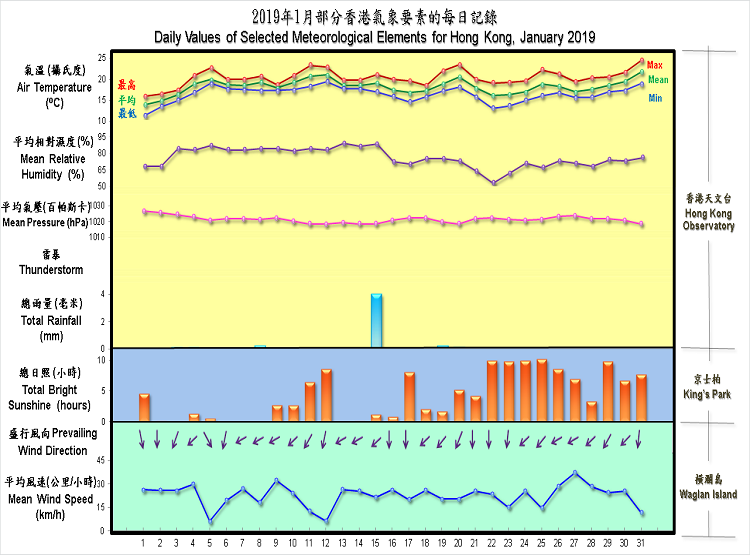
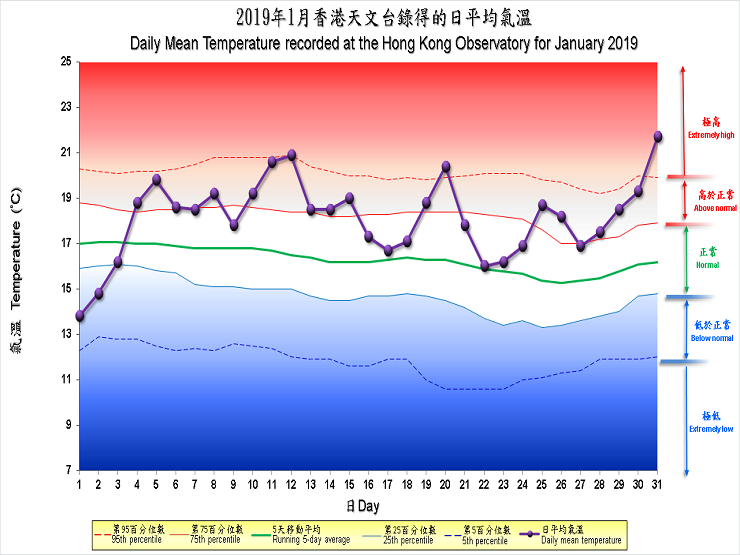
With relatively less cold air outbreaks from the north arriving at the south China coast in the month, January 2019 was much warmer than usual in Hong Kong. The monthly mean temperature of 18.1 degrees and monthly mean minimum temperature of 16.4 degrees were 1.8 degrees and 1.9 degrees above their corresponding normals and both were the third highest on record for January. The mean maximum temperature of 20.4 degrees was 1.8 degrees above the normal and the fifth highest on record for January. The month was also drier than usual with only 4.7 millimetres of rainfall recorded in the month, about one fifth of the normal of 24.7 millimetres for January.
The intense winter monsoon that started to affect the south China coastal areas in late December 2018 continued its dominance and brought cold weather to Hong Kong on the first day of January 2019. The minimum temperature of 11.4 degrees recorded at the Hong Kong Observatory on that day was the lowest of the month. The weather was cloudy and cool with a few rain patches in the next two days. With the monsoon moderating, there were sunny intervals with local temperatures rising gradually on 4 - 5 January. Affected by a weak replenishment of the northeast monsoon, it was generally cloudy with a few rain patches on 6 - 8 January.
The weather of Hong Kong turned windy when a fresh to strong easterly airstream affected the south China coastal areas on 9 January. With the easterlies subsiding, local weather became milder with sunny periods and low visibility episodes on 10 - 12 January. With the easterlies strengthening again on 13 - 14 January, the weather was generally cloudy with light rain patches and morning mist.
Affected by the northeast monsoon over the south China coastal areas, it was cooler with some rain patches on 15 January. Local weather remained cloudy and cool on the next day. With the clouds covering the coastal areas dissipating, the weather turned fine gradually during the day on 17 January. An easterly airstream gradually replaced the monsoon on 18 January and the weather in Hong Kong became mainly cloudy with a few light rain patches again on 18 - 19 January. With the moderation of the easterly winds, apart from a few light rain patches in the morning and at night, it was warm with sunny periods during the day on 20 January.
Meanwhile, the dry northeast monsoon reached the South China coastal areas on the night of 20 January. Under the influence of the dry northeast monsoon and its subsequent replenishment on 26 January, the weather of Hong Kong turned generally fine and dry with cool mornings on 21 - 28 January. With the northeast monsoon moderating gradually, it was mild with sunny periods towards the end of the month. The weather was rather warm on 31 January with the maximum temperature at the Observatory soaring to 24.5 degrees, the highest of the month.
One tropical cyclone occurred over the South China Sea and the western North Pacific in the month.
Details of issuance and cancellation of various warnings/signals in the month are summarized in Tables 1.1 to 1.2. Monthly meteorological figures and departures from normal for January are tabulated in Table 2.
Warnings and Signals issued in January 2019
| Colour | Beginning Time | Ending Time | ||
|---|---|---|---|---|
| Day/Month | HKT | Day/Month | HKT | |
| Yellow | 1 / 1 | 0600 | 1 / 1 | 1740 |
| Yellow | 20 / 1 | 0600 | 20 / 1 | 1830 |
| Red | 22 / 1 | 0600 | 23 / 1 | 1845 |
| Yellow | 26 / 1 | 0600 | 26 / 1 | 1800 |
| Yellow | 27 / 1 | 0600 | 27 / 1 | 1850 |
| Beginning Time | Ending Time | ||
|---|---|---|---|
| Day/Month | HKT | Day/Month | HKT |
| 28 / 12 | 2000 | 2 / 1 | 1620 |
| Meteorological Element | Figure of the Month | Departure from Normal* |
|---|---|---|
| Mean Daily Maximum Air Temperature | 20.4 degrees C | 1.8 degrees above normal |
| Mean Air Temperature | 18.1 degrees C | 1.8 degrees above normal |
| Mean Daily Minimum Air Temperature | 16.4 degrees C | 1.9 degrees above normal |
| Mean Dew Point Temperature | 13.7 degrees C | 2.3 degrees above normal |
| Mean Relative Humidity | 76 % | 2 % above normal |
| Mean Cloud Amount | 68 % | 7 % above normal |
| Total Rainfall | 4.7 mm | 20.0 mm below normal |
| Number of hours of Reduced VisibilityΔ | 114 hours | 112.8 hours below normal§ |
| Total Bright Sunshine Duration | 133.3 hours | 9.7 hours below normal |
| Mean Daily Global Solar Radiation | 10.98 Megajoule / square metre | 0.81 Megajoule above normal |
| Total Evaporation | 67.5 mm | 3.8 mm below normal |
| Remarks : | All measurements were made at the Hong Kong Observatory except sunshine,
solar radiation and evaporation which were recorded at King's Park
Meteorological Station and visibility which was observed at the Hong
Kong International Airport. |
| Δ | The visibility readings at the Hong Kong International Airport are based on hourly observations by professional meteorological observers in 2004 and before, and average readings over the 10-minute period before the clock hour of the visibility meter near the middle of the south runway from 2005 onwards. The change of the data source in 2005 is an improvement of the visibility assessment using instrumented observations following the international trend.
|
* Departure from 1981 - 2010 climatological normal, except for number of hours of reduced visibility |
|
§ Departure from mean value between 1997 and 2018 |
|
| Remarks : | Extremely high: above 95th percentile Above normal: between 75th and 95th percentile Normal: between 25th and 75th percentile Below normal: between 5th and 25th percentile Extremely low: below 5th percentile Percentile and 5-day running average values are computed based on the data from 1981 to 2010 |
