Tropical Cyclones in 2017 > Figure 3.3.9

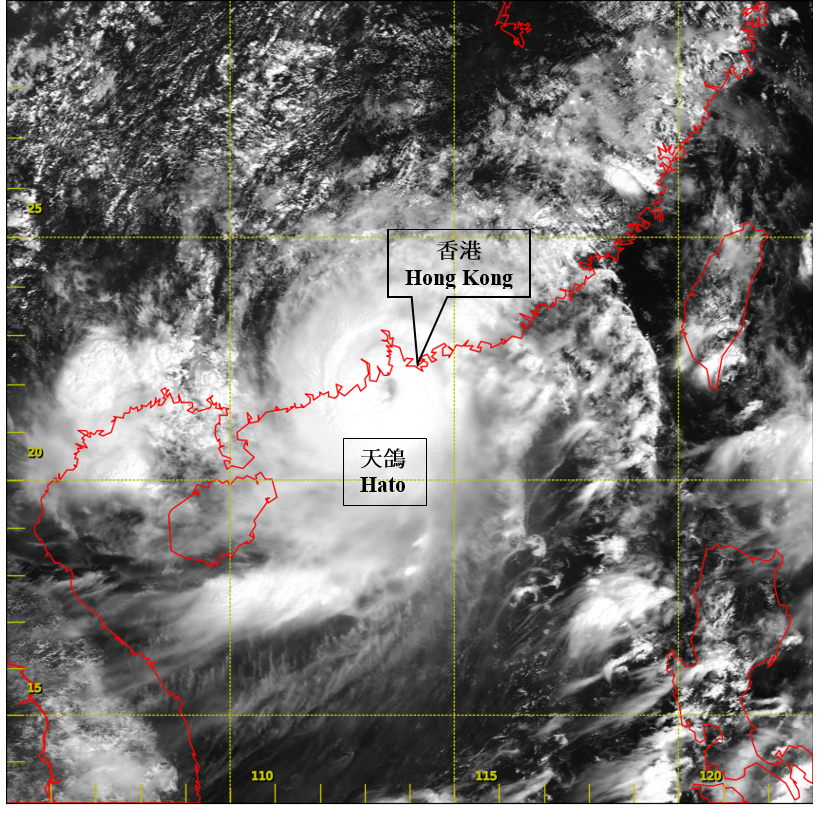
Figure 3.3.9 Visible satellite imagery around 11 a.m. on 23 August 2017, when Hato was at peak intensity with estimated maximum sustained winds of 185 km/h near its centre.
[The satellite imagery was originally captured by the Himawari-8 Satellite (H-8) of Japan Meteorological Agency (JMA).] |