Skip Content
Report on Severe Tropical Storm Wutip (2501)
Report on Severe Tropical Storm Wutip (2501)
Figures
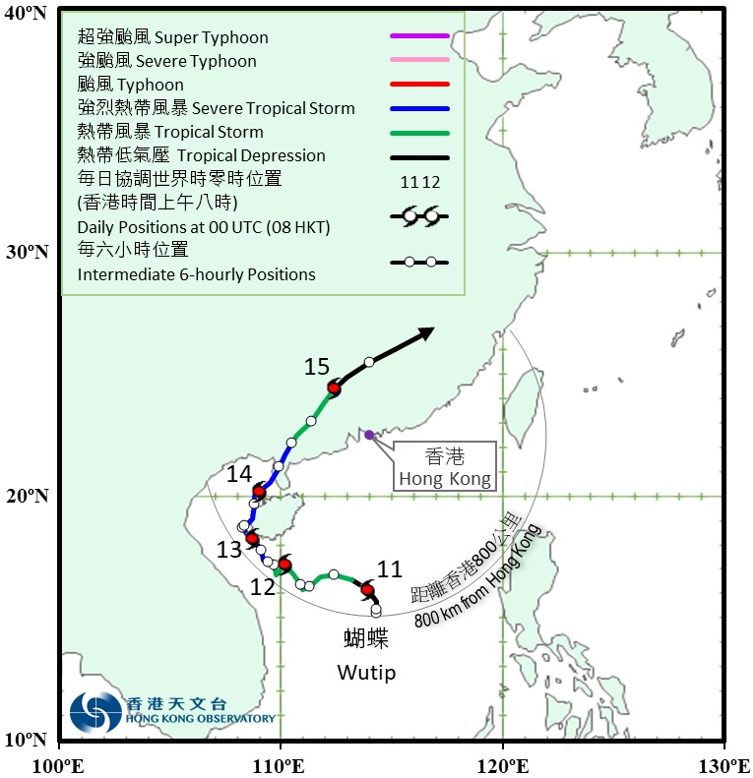
Figure 1: Provisional track of Wutip (2501): 10 - 15 June 2025
Figure 2: Rainfall distribution on 11 – 15 June 2025
Figure 3a: 10-minute mean wind direction and speed recorded at various stations in Hong Kong at 11:50 p.m. on 14 June 2025
Figure 3b: 10-minute mean wind direction and speed recorded at various stations in Hong Kong at 12:10 p.m. on 15 June 2025
Figure 4: Visible satellite imagery at around 2 p.m. on 13 June 2025
Figure 5: Radar echoes captured at 5:00 a.m. on 15 June 2025
Tables
Table 1: Maximum gust peak speeds and maximum hourly mean winds with associated wind directions recorded at various stations when the tropical cyclone warning signals for Wutip were in force
Table 2: Periods during which sustained strong winds were attained at the eight reference anemometers in the tropical cyclone warning system when tropical cyclone warning signals for Wutip were in force
Table 3: Daily rainfall amounts recorded at the Hong Kong Observatory Headquarters and other stations during the passage of Wutip
Table 4: Times and heights of the maximum sea level and the maximum storm surge recorded at tide stations in Hong Kong during the passage of Wutip