Solar Energy Resources in Hong Kong from a Climatological Point of View
Solar Energy Resources in Hong Kong from a Climatological Point of View
CHONG Sze-ning and LEE Tsz-cheung
September 2014
Solar energy is one of the main renewable energy resources. Its application is also an important aspect in climate change mitigation. Along with the advances in science and technology, the use of solar energy in daily life (such as solar panels and solar water heaters) has gradually gained popular acceptance. According to a recent survey, Hong Kong people responded positively towards the increasing use of solar power [1]. The Hong Kong Observatory has also been using solar cells to power some of its automatic weather stations since the 1980s [2].
The collection efficiency of solar energy has large seasonal and regional variations, depending on the local amount of solar radiation as well as other environmental factors. Located along the coast of southern China, Hong Kong has a relatively higher level of solar radiation compared to the central and eastern parts of China (Figure 1). As such, solar energy is considered a renewable energy resource worth exploring. The Observatory has been monitoring global solar radiation since 1958, and the measuring instrument was moved to King's Park in the following year. In 2008, another solar radiation station was set up in Kau Sai Chau. Currently, the two stations are monitoring both global and direct solar radiation in Hong Kong [3-4].
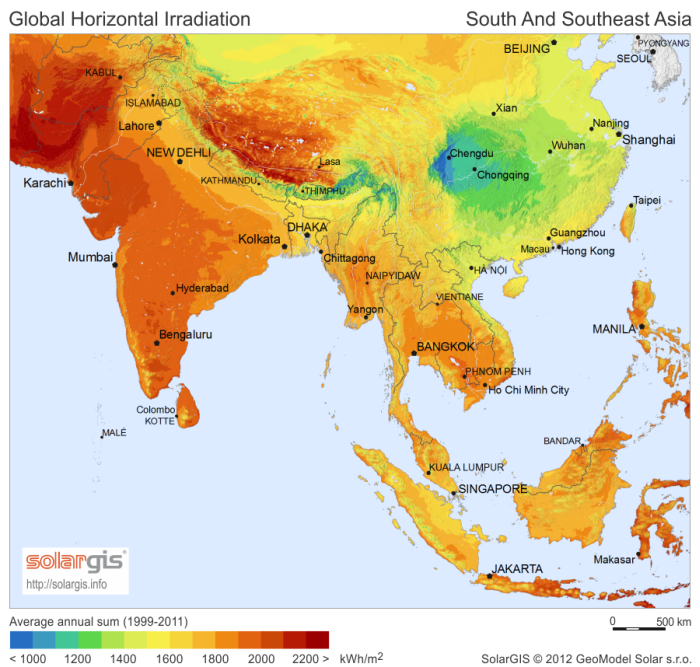
Figure 1 Map of Global Horizontal Irradiation in South and Southeast Asia (Source: SolarGIS)
Two major factors have to be considered when we evaluate solar energy resources available in Hong Kong. The first one is the geographical position: at a latitude of about 22°N, Hong Kong has the Sun shining usually from the south at noon. In general, the amount of radiation increases with the elevation angle of the Sun. In the course of a year, the elevation angle during the Sun's transit over Hong Kong's meridian varies between a minimum value of about 44° at the Winter Solstice to a maximum of 90° [5]. The second factor is the temporal and seasonal variations of solar radiation. Table 1 shows the climatological normals of monthly sunshine duration and global solar radiation (1981-2010) at King's Park. The amount of solar radiation in general peaks in July, and overall is more abundant in the second half of the year than the first half. Figure 2 shows that global radiation at King's Park has generally increased in recent years (2009-2013). Location-wise, Kau Sai Chau at a more rural setting has a slightly higher amount of direct solar radiation in most months than King's Park in a more urban environment. In actual applications, the effect of local ambient conditions on solar radiation should not be neglected, especially in a highly developed city like Hong Kong where many skyscrapers hinder the sky view and restrict the amount of sunshine received.
| Month | Bright Sunshine | Daily Global Solar Radiation (MJ/m2) |
|
|---|---|---|---|
| Duration (hours) | Availability Percentage (%) | ||
| January | 143.0 | 42 | 10.17 |
| February | 94.2 | 29 | 9.39 |
| March | 90.8 | 24 | 9.96 |
| April | 101.7 | 27 | 11.60 |
| May | 140.4 | 34 | 14.19 |
| June | 146.1 | 36 | 14.19 |
| July | 212.0 | 51 | 17.17 |
| August | 188.9 | 47 | 15.63 |
| September | 172.3 | 47 | 14.61 |
| October | 193.9 | 54 | 14.05 |
| November | 180.1 | 54 | 12.28 |
| December | 172.2 | 51 | 10.89 |
| Year | 1835.6 | >42 | 12.85 |
Table 1 Monthly means of sunshine duration and daily global solar radiation recorded at King's Park in 1981-2010
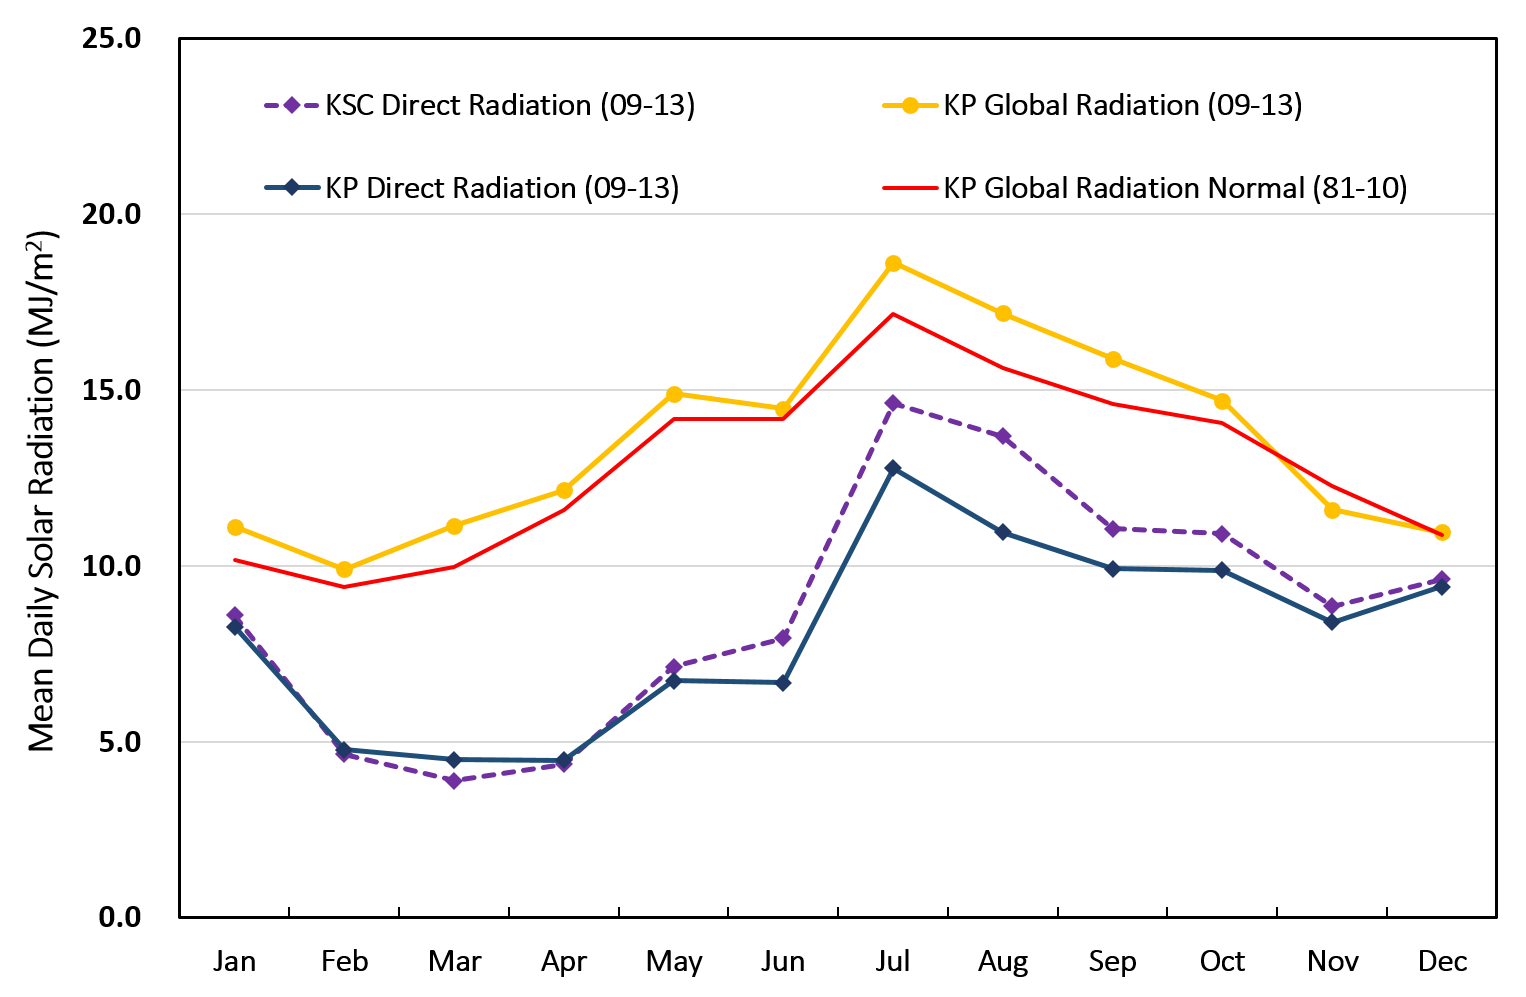
Figure 2 Monthly mean of daily solar radiation recorded at King's Park (KP) and Kau Sai Chau (KSC) in 2009-2013
Variation trends in solar radiation over the years also have implications for the long term application of solar energy resources. With an increasing trend in the mean cloud amount in the past few decades (Figure 3) and a rising trend in the number of hours of reduced visibility under 8 km (Figure 4), there is an overall decreasing trend in the total global solar radiation in Hong Kong (Figure 5). Although there seems to be a slight rebound in the solar radiation in recent years as illustrated in Figure 2, further monitoring is still required to affirm this observed trend.
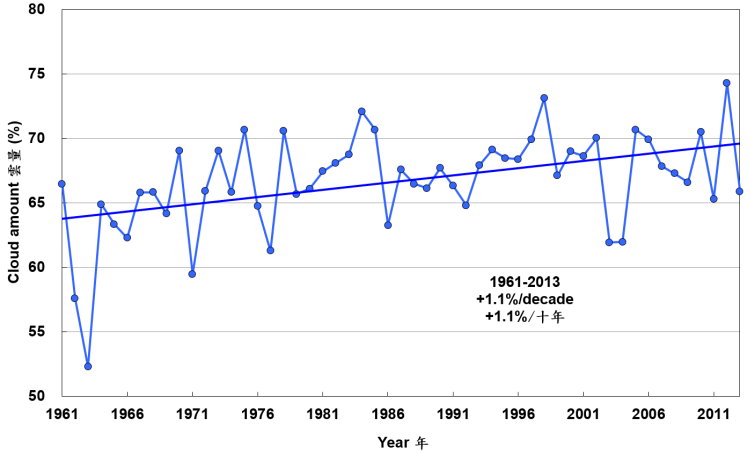
Figure 3 Annual mean cloud amount recorded at the Hong Kong Observatory Headquarters (1961-2013). Regression result indicates that the annual mean cloud amount has been increasing at a rate of 1.1% per decade since 1961.
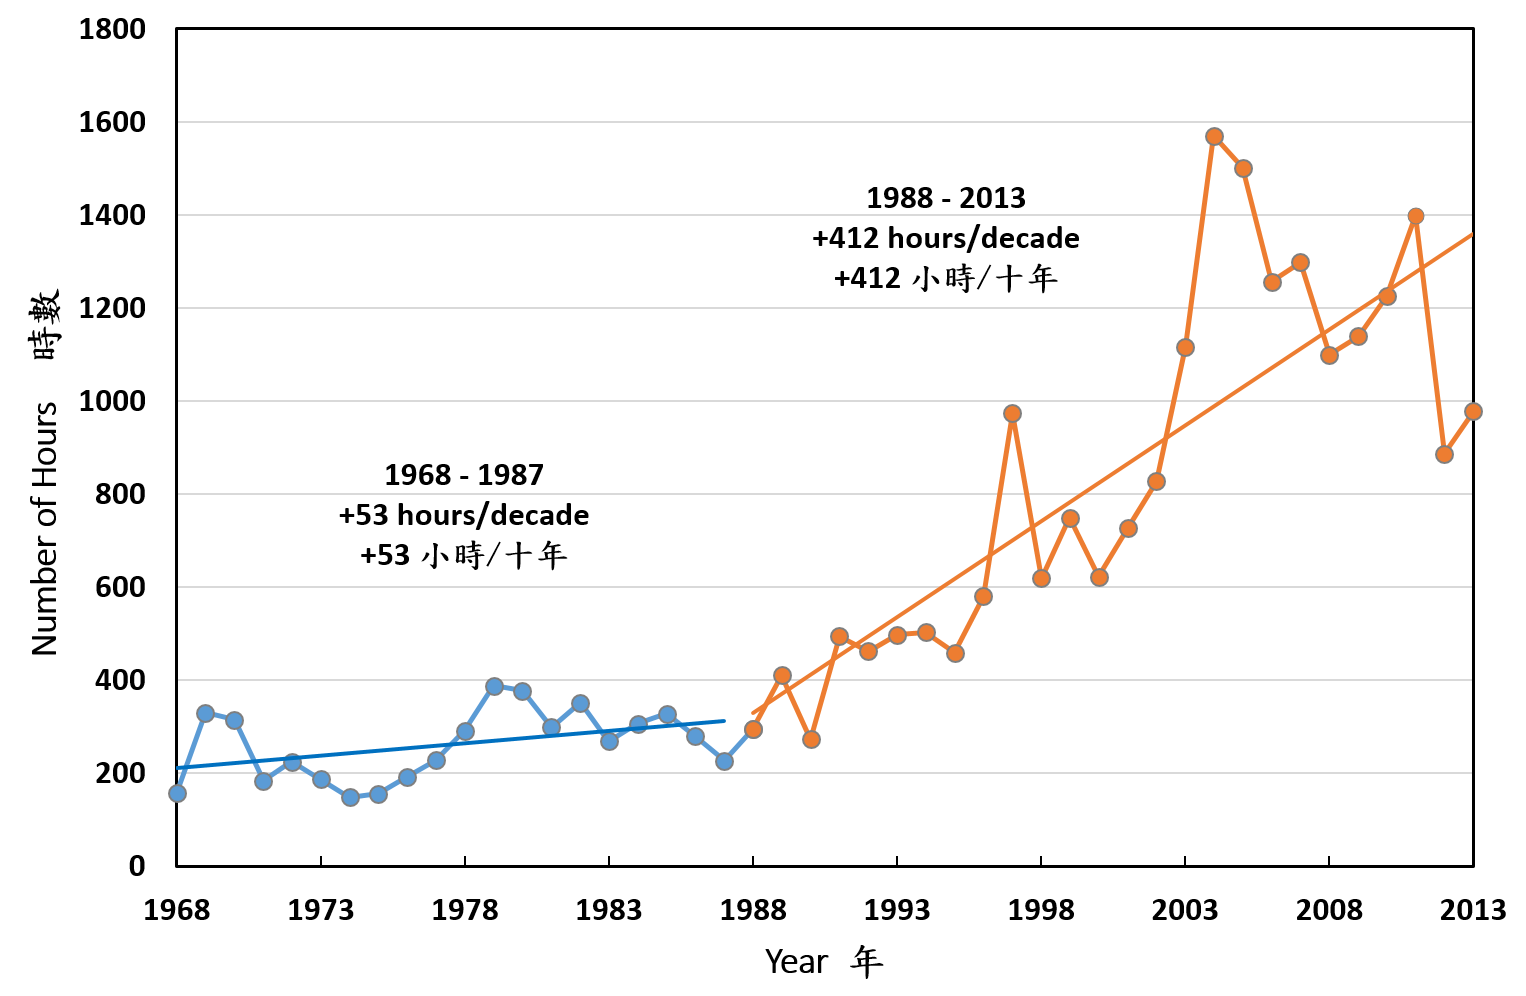
Figure 4 Annual number of hours of reduced visibility under 8 km observed at the Hong Kong Observatory Headquarters (1968-2013) excluding cases of fog, mist, precipitation or relative humidity higher than or equal to 95%.
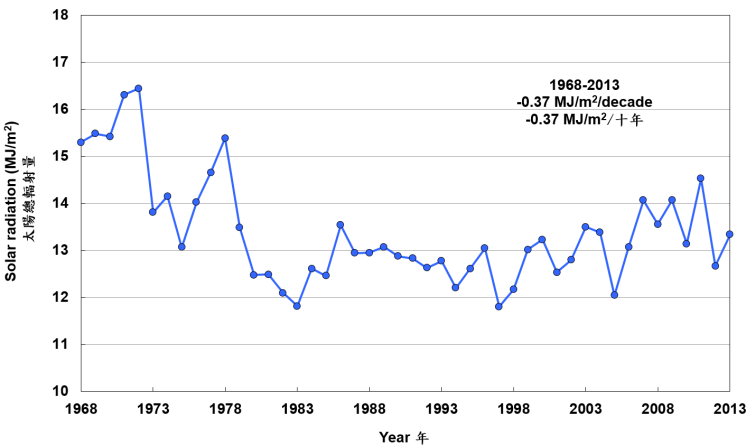
Figure 5 Annual mean daily total global solar radiation at King's Park (1968-2013)
References:
[1] Civic Exchange (2013), A Snapshot of Hong Kong People's Attitudes Towards Power Sources and Climate Change
[2] The Observatory's Use of Renewable Energy
[3] Direct and Diffuse Solar Radiation Information Added to Observatory's website
[4] How to Measure Sunshine Duration?
[5] The Sun is nearest to being directly overhead at Hong Kong twice a year, around 3 June and 10 July.