Unveiling the Boundary Between the Earth's Crust and Mantle with Seismic Waves
Unveiling the Boundary Between the Earth's Crust and Mantle with Seismic Waves
CHAN Yuk-po Bowie
May 2024
The interior of the Earth that cannot be directly explored
The Earth’s average radius spans more than 6300 kilometres[1]. However, to this day, human exploration below the Earth’s surface remains very limited. The deepest investigation of the bottom of the ocean took place in the Pacific Ocean, under the 8-kilometre-deep seabed, where humans collected a 37.74-meter-long sediment core[2]. And the deepest one on land is the Kola Superdeep Borehole located in northwest Russia, with a depth of 12.2 kilometres[3], yet it is still shallower than 0.2% of the Earth's depth. Although humans cannot directly observe the interior of the Earth, its structures and characteristics can be indirectly inferred from the seismic waves passing through the interior of the Earth. Since humans first recorded a teleseismic earthquake using a seismometer in 1889[4] (Figure 1), scientists from all over the world have successively discovered the main structures of the Earth's interior in just 50 years. In this article, we will reveal how scientists unlock the secrets of the Earth from seismic waves.
![Figure 1 The first widely recognised teleseismic seismogram recorded a magnitude 5.8 earthquake from Japan on April 17, 1889, in Potsdam, Germany (Source: Von Rebeur-Paschwitz, 1889 [4])](../../../../tc/education/earth-science/earthquake/images/717_fig1_teleseismic_seismogram.jpg)
Figure 1 The first widely recognised teleseismic seismogram recorded a magnitude 5.8 earthquake from Japan on April 17, 1889, in Potsdam, Germany (Source: Von Rebeur-Paschwitz, 1889[4])
How do seismic waves propagate?
Part of the elastic potential energy released during an earthquake propagates from the hypocentre to the interior of the earth in all directions in the form of seismic waves. Seismic velocity depends on many factors, such as the composition, temperature, and pressure of the Earth’s interior. When seismic waves travel through a medium of the same velocity, it travels in a straight line. However, the seismic ray path is rarely a straight line in reality. This is due to the existence of media with different seismic velocities in the Earth’s interior, leading to the refraction of seismic waves, and thus the bending of ray path in the continuous media. Within the crust, the seismic velocity typically increases with the depth of the rock (Figure 2).
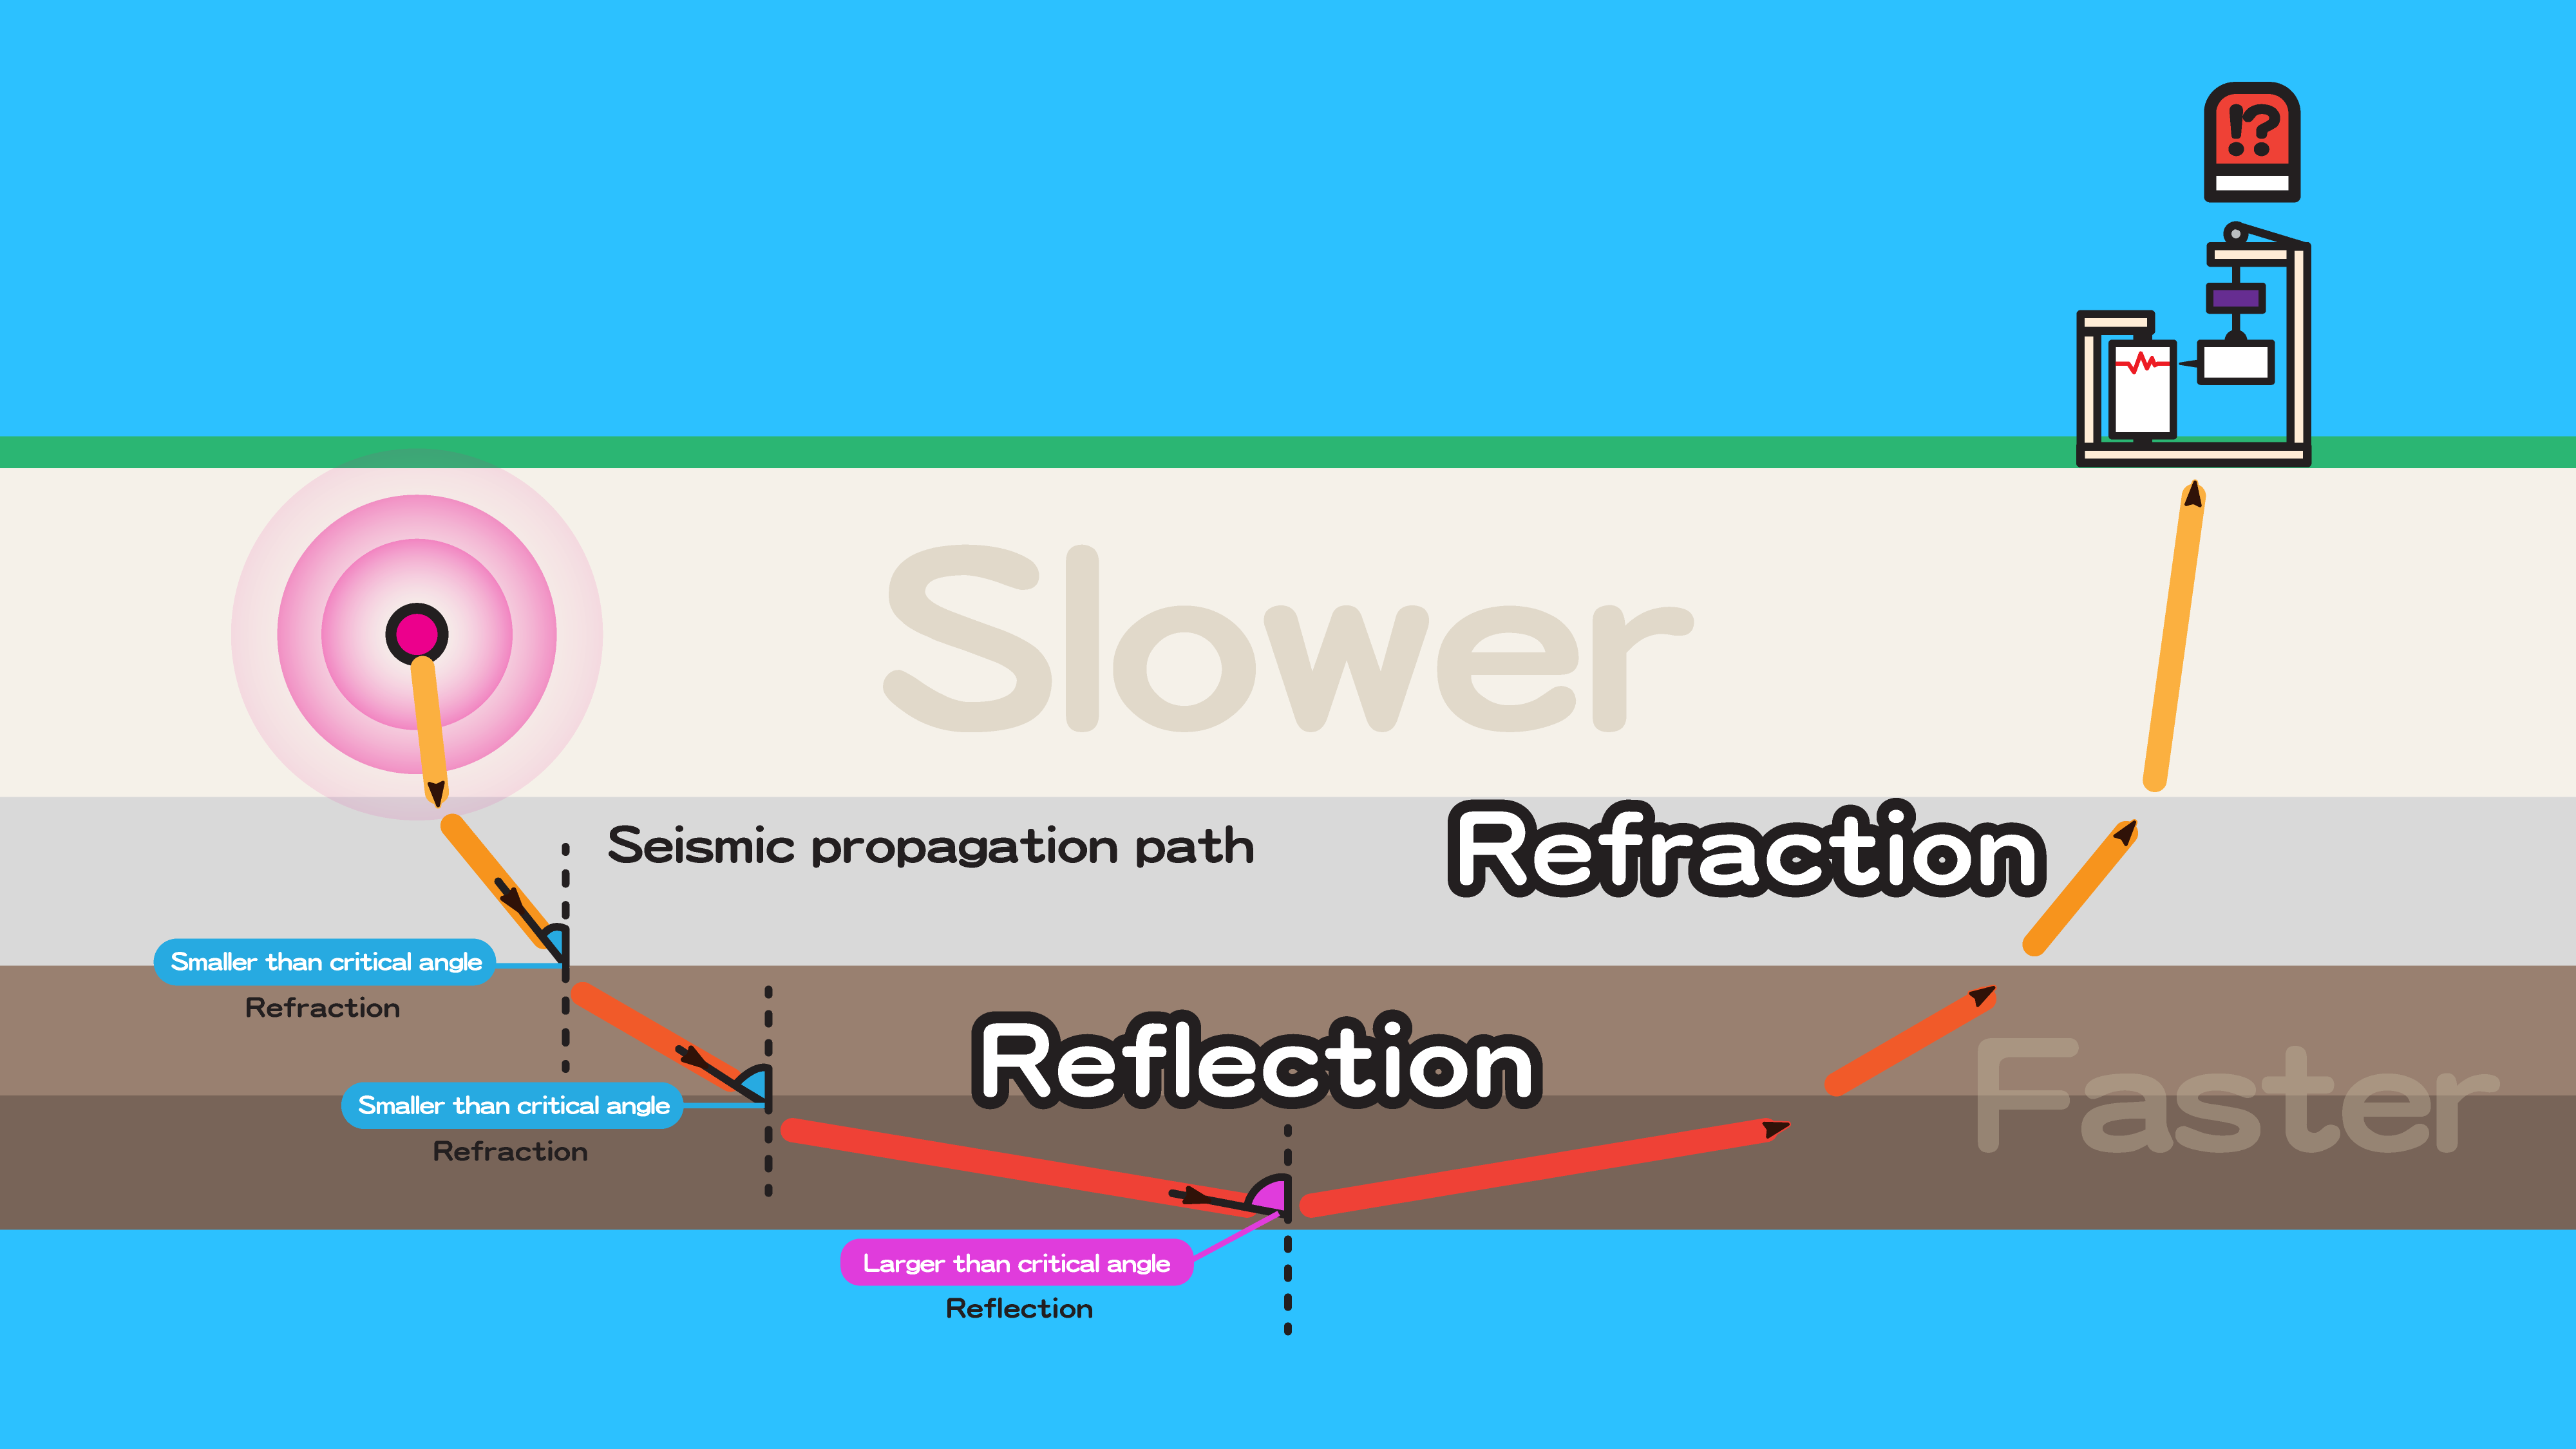
Figure 2 A schematic diagram for the bending of ray path as the seismic waves pass through media with different seismic velocities. When the seismic waves enter a high-velocity layer, part of the seismic waves would be refracted at an angle larger than the incidence angle if the incidence angle is smaller than the critical angle. If the incidence angle is larger than the critical angle, the seismic waves would be reflected.
Consider a simple two-layer model (Figure 3). The seismic waves propagate slower in the upper layer of rock, while faster in the lower layer. The seismic waves from different propagation directions will take respective paths from the hypocentre to the ground surface. Here we focus on two distinct propagation paths. "Direct wave" refers to the seismic waves traveling the shortest distance from the hypocentre to the seismometer in the upper layer. When seismic waves enter deeper and higher propagation speed layers, if the incident angle is less than the critical angle, part of the seismic waves will be refracted and part will be reflected. If the incident angle equals the critical angle, the seismic waves will advance along the interface with a higher velocity and arrive at the ground faster, known as the "head wave"[5].

Figure 3 A schematic diagram for the seismic ray path in a two-layer model.
Seismogram Interpretation
Seismic waves are classified into body waves and surface waves. Body waves can propagate in the interior of the Earth while surface waves only travel on the ground surface. Among the body waves, the longitudinal waves, also known as the P waves, has the fastest propagation speed. Therefore, the first arrival signal detected by the seismometers after an earthquake is the P wave. By linking the first arrivals detected by the seismometers at different distances, we can obtain the “travel time curve” (Figure 4). After analysing the seismograms, Andrija Mohorovičić the scientist discovered that the slopes of the first arrivals travel time curves near the hypocentre are distinct from that after reaching a certain distance. The drop in slope indicates an increase in the average speed of seismic waves for the farther paths, as compared with the nearer ones. (Quick quiz: Can you find the distance at which the slope of the travel time curve becomes inconsistent from Mohorovičić’s travel-time curves[6] (Figure 5)?)
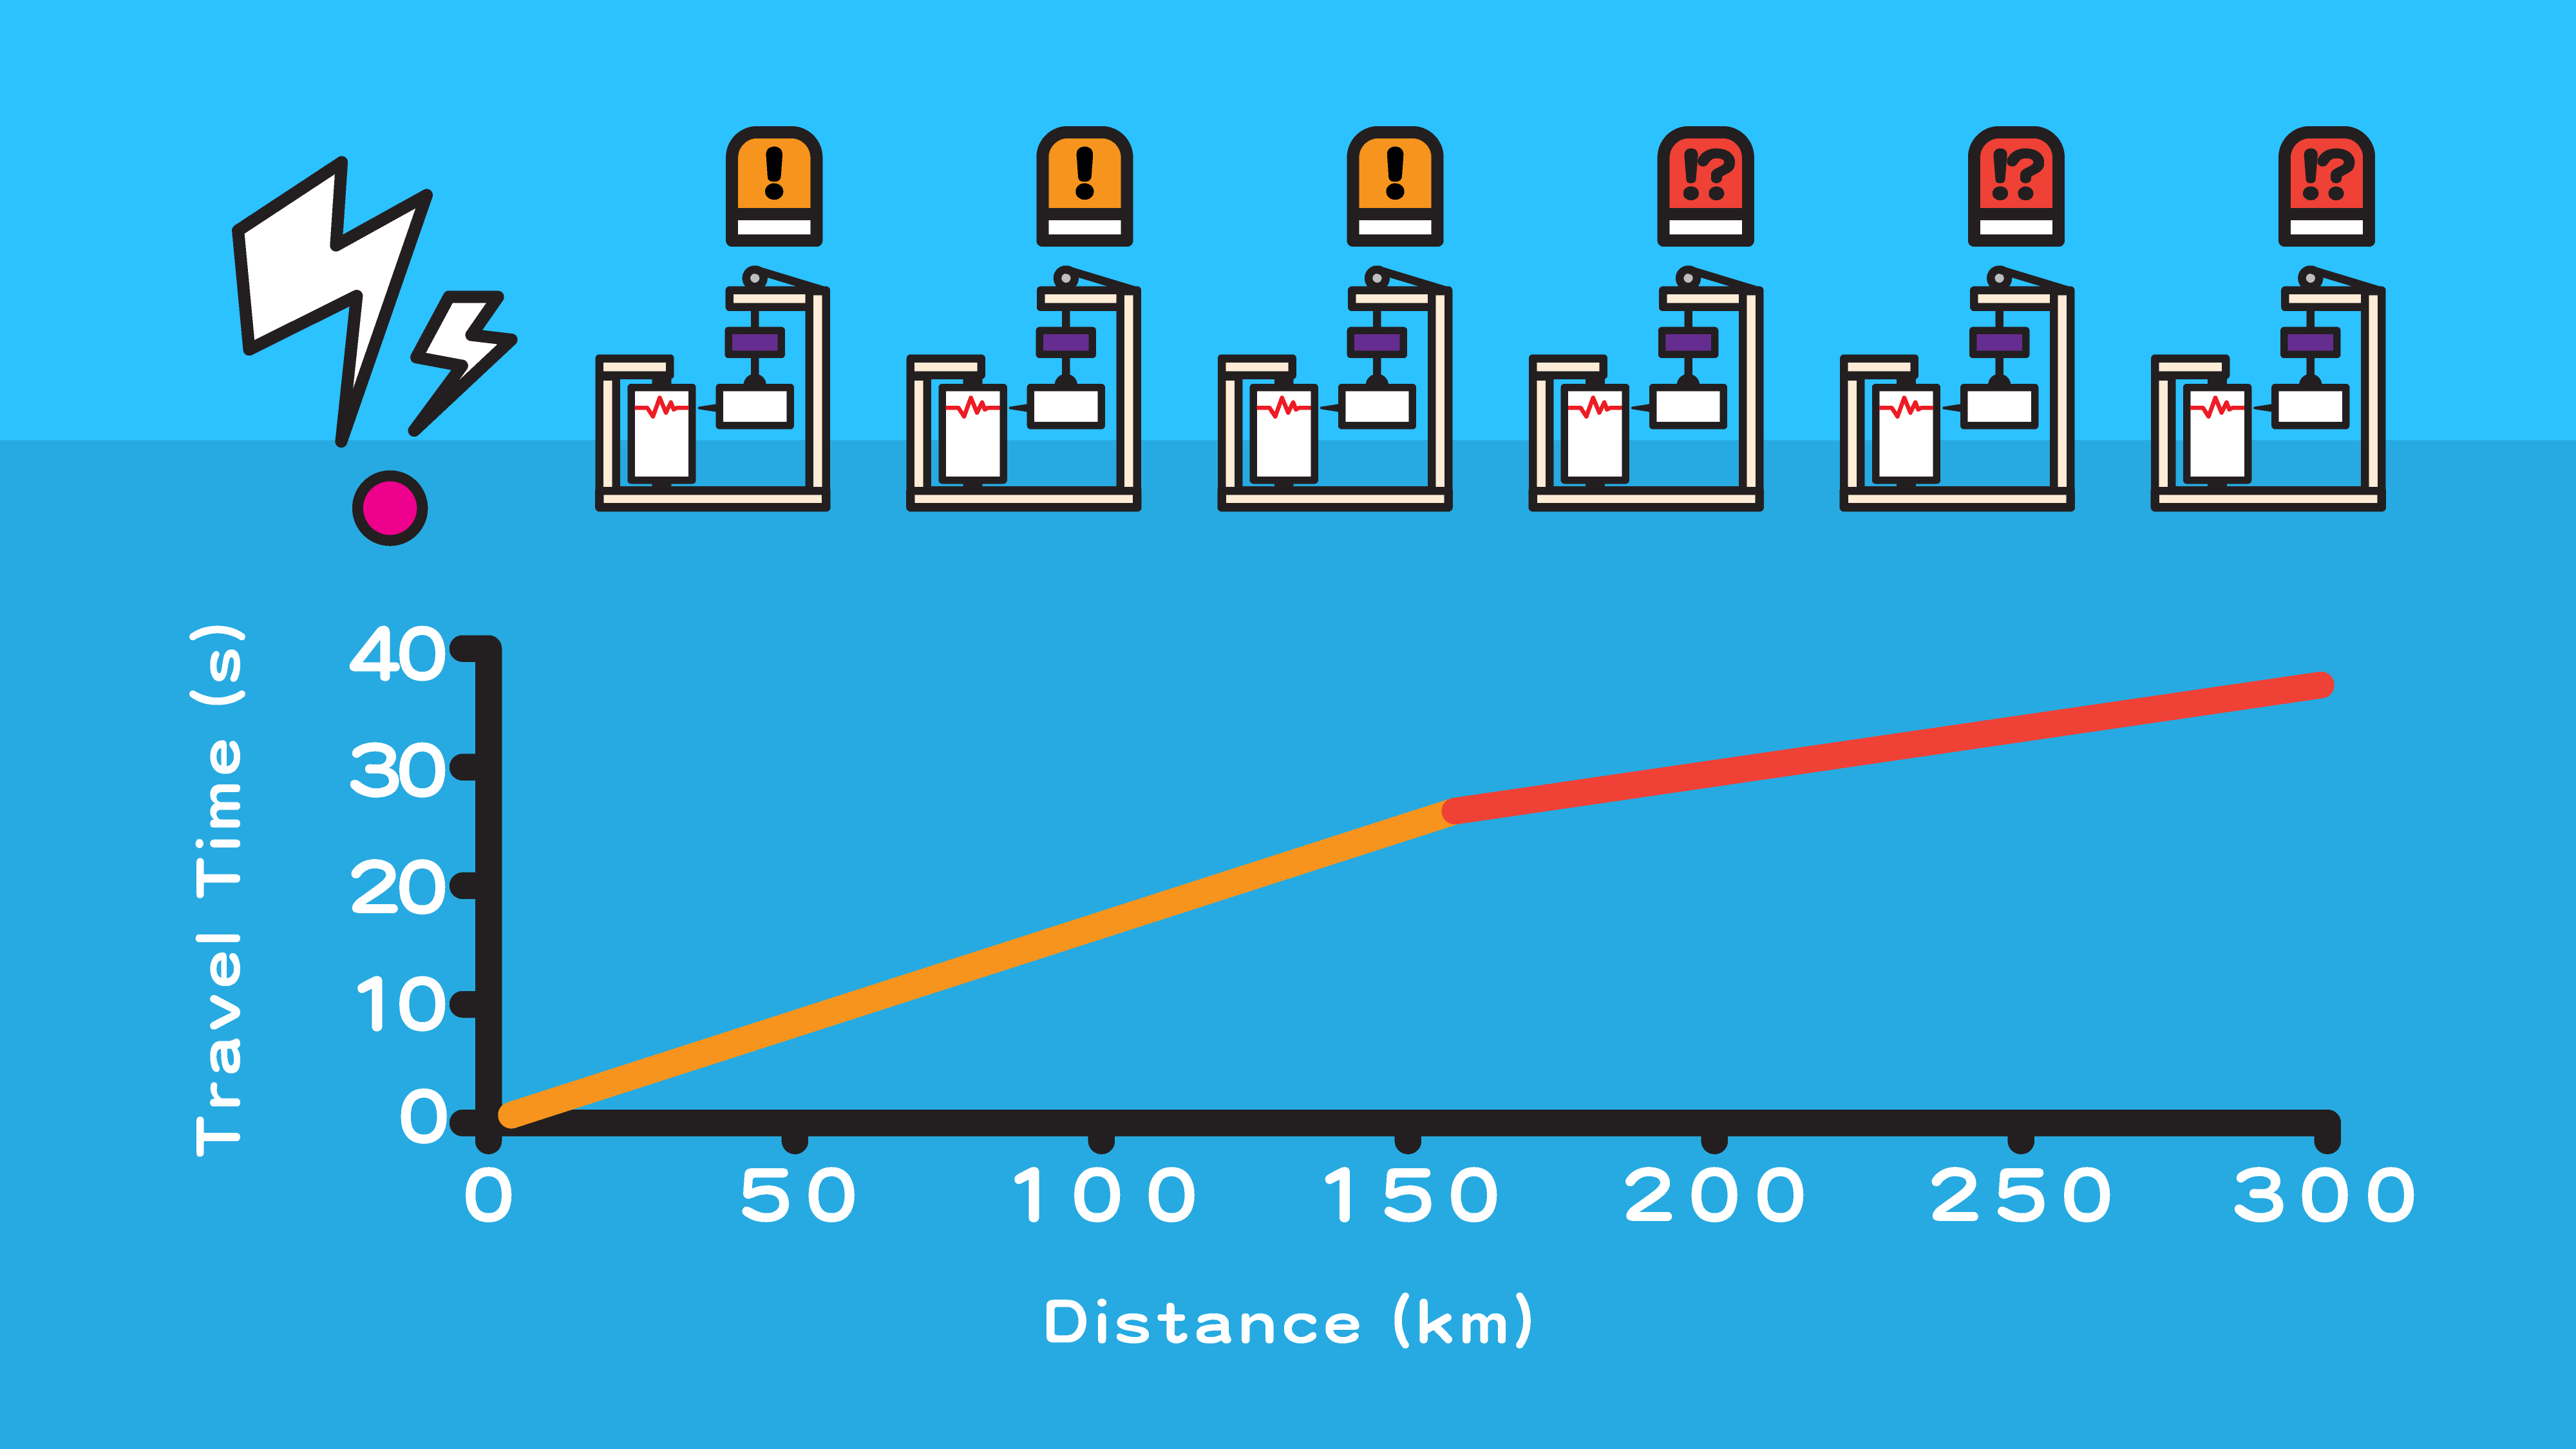
Figure 4 A schematic diagram for the first arrivals travel time curve, demonstrating the time required for the seismic waves to initially reach the seismometers at different distances from the hypocentre.
![Figure 5 Redrawn Mohorovičić’s travel-time curves. The observed arrivals of different seismic phases are marked with dots. Lines represent the theoretical travel-time curves for direct waves, head waves, and reflected waves based on the best-fitting model of the crust and the upper mantle [6, 7]. (Source: Mohorovičić, A., 1910/1992, licensed under CC BY-NC 4.0)](../../../../en/education/earth-science/earthquake/images/717_fig5_travel_time_curve.png)
Figure 5 Redrawn Mohorovičić’s travel-time curves. The observed arrivals of different seismic phases are marked with dots. Lines represent the theoretical travel-time curves for direct waves, head waves, and reflected waves based on the best-fitting model of the crust and the upper mantle[6],[7]. (Source: Mohorovičić, A., 1910/1992, licensed under CC BY-NC 4.0)
Why do first arrivals suddenly speed up?
To answer this question, we must first analyse the paths of these first arrivals. Let’s imagine multiple seismometers are deployed on the ground (Figure 3). For seismic stations near the hypocentre, the paths of the direct waves are shorter than that of the head waves in the low-velocity layer, so the first arrivals detected by the seismometers naturally originate from the direct wave. But as the distance increases, the head waves, which travel faster at the interface between the two layers, have caught up with the direct waves propagating in the low-velocity layer. Hence, the first arrivals detected by the seismometers located at a certain distance from the hypocentre are produced by the head waves.
The discovery of the "Moho discontinuity"
Mohorovičić’s discovery proved that there exists a discontinuity that contributes to a distinct seismic velocity contrast, which is the interface between the crust and the mantle, later named the "Moho ". The crustal P wave velocity above the Moho is about 6 km/s, while the mantle P wave velocity below is approximately 8 km/s. The crust and the mantle have obvious differences in chemical composition. The mantle is rich in iron- and magnesium-bearing silicate minerals, while the continental (oceanic) crust is composed of silicate minerals rich in potassium, sodium, and aluminium (rich in iron, magnesium, calcium, and aluminium)[8]. Due to the isostasy, the depth of the Moho varies around the world. The Moho below continents is about 38 kilometres deep on average[9], and it could extend as deep as 65 kilometres or below under orogenic belts[10].
References :
[1] NASA: Earth Fact Sheet
[2] Modern Sciences (2021): Scientists Just Dug Out the Deepest Ocean Hole Ever
[3] BBC News (2019): The deepest hole we have ever dug
[4] Von Rebeur-Paschwitz, E. (1889). The earthquake of Tokio, April 18, 1889. Nature, 40(1030), 294-295.
[5] UCL: Earthquake Seismology I
[6] Mohorovičić, A. (1992). Earthquake of 8 october 1909. Geofizika, 9(1), 3-55. (Original work published 1910)
[7] Herak, D., Herak, M. (2007): Andrija Mohorovičić (1857-1936) – On the occasion of the 150th anniversary of his birth. SSA Historical Seismologist.
[8]Geotechnical Engineering Office, Civil Engineering and Development Department: Hong Kong Geology – A 400-Million Year Journey, Plate Tectonics – Formidable Forces, Structure of the Earth
[9] Baranov, A., & Morelli, A. (2014): The global Moho depth map for continental crust. In EGU General Assembly Conference Abstracts (p. 16384).
[10]Shin, Y. H., Shum, C. K., Braitenberg, C., Lee, S. M., Na, S. H., Choi, K. S., ... & Lim, M. (2015): Moho topography, ranges and folds of Tibet by analysis of global gravity models and GOCE data. Scientific reports, 5(1), 11681.