Skip Content

Global Climate Projections - Mean Sea Level

Global Climate Projections

<<Precipitation

Mean sea level

Extreme weather events>>

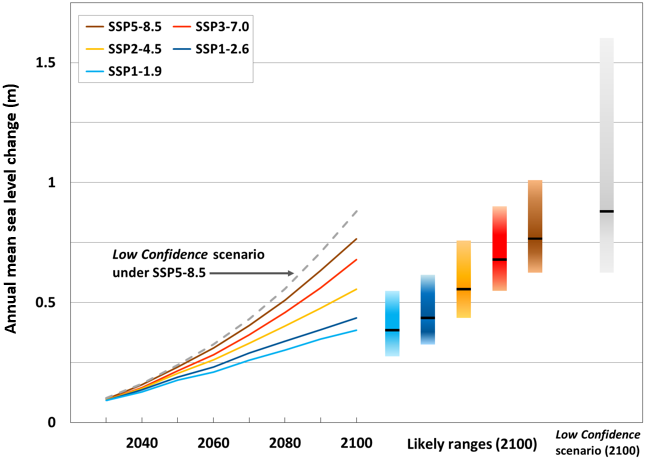
Global mean sea level will continue to rise over the 21st century. Relative to 1995-2014, the likely global mean sea level rise by 2100 is 0.28-0.55 m, 0.44-0.76 m and 0.63-1.01 m under the very low (SSP1-1.9), intermediate (SSP2-4.5) and very high (SSP5-8.5) greenhouse gas emissions scenarios respectively. To indicate the potential impact of deeply uncertain ice sheet processes, a Low Confidence scenario under SSP5-8.5 is also considered by IPCC. In the longer term, sea level is committed to rise for centuries to millennia due to continuing deep ocean warming and ice sheet melt.

Global mean sea level change (m) relative to 1995-2014

Global mean sea level change relative to 1995-2014. Coloured solid curves and the grey broken curve show median projections under the 5 emissions scenarios and the SSP5-8.5 Low Confidence scenario respectively. Black horizontal lines indicate median projections (2100). Coloured bars indicate likely ranges (2100) under the 5 emissions scenarios. The probability for the likely range to cover the outcome is at least 66%. The grey bar indicates the 17th-83rd percentile range of projection (2100) under the SSP5-8.5 Low Confidence scenario. (Data source: IPCC AR6)

SSP1-1.9

median
(likely range)
SSP1-2.6

median
(likely range)
SSP2-4.5

median
(likely range)
SSP3-7.0

median
(likely range)
SSP5-8.5

median
(likely range)
SSP1-2.6
Low Confidence

median
(17th–83rd
percentile range)
SSP2-4.5
Low Confidence

median
(17th–83rd
percentile range)
SSP5-8.5
Low Confidence

median
(17th–83rd
percentile range)
Total / m (2030) 0.09
(0.08–0.12)
0.09
(0.08–0.12)
0.09
(0.08–0.12)
0.10
(0.08–0.12)
0.10
(0.09–0.12)
0.10
(0.08–0.14)
0.10
(0.08–0.14)
0.10
(0.09–0.15)
Total / m (2050) 0.18
(0.15–0.23)
0.19
(0.16–0.25)
0.20
(0.17–0.26)
0.22
(0.18–0.27)
0.23
(0.20–0.29)
0.20
(0.16–0.31)
0.21
(0.17–0.32)
0.24
(0.20–0.40)
Total / m (2090) 0.35
(0.26–0.49)
0.39
(0.30–0.54)
0.48
(0.38–0.65)
0.56
(0.46–0.74)
0.63
(0.52–0.83)
0.40
(0.30–0.68)
0.49
(0.38–0.75)
0.71
(0.52–1.30)
Total / m (2100) 0.38
(0.28–0.55)
0.44
(0.32–0.62)
0.56
(0.44–0.76)
0.68
(0.55–0.90)
0.77
(0.63–1.01)
0.45
(0.32–0.79)
0.56
(0.44–0.88)
0.88
(0.63–1.60)
Total / m (2150) 0.57
(0.37–0.86)
0.68
(0.46–0.99)
0.92
(0.66–1.33)
1.19
(0.89–1.65)
1.32
(0.98–1.88)
0.73
(0.46–1.34)
0.97
(0.66–1.53)
1.98
(0.98–4.82)

Global mean sea level projections relative to 1995–2014. White cells represent processes in whose projections there is medium confidence. The probability for the likely range to cover the outcome is at least 66%. Grey cells incorporate a representation of processes in which there is low confidence. The Low Confidence columns show the 17th–83rd percentile range, not likely range. Data source: Table 9.9 of IPCC Working Group I contribution to the Sixth Assessment Report / Sea Level Projection Tool (https://sealevel.nasa.gov/ipcc-ar6-sea-level-projection-tool)

Data source:

  1. Fox-Kemper, B., H. T. Hewitt, C. Xiao, G. Aðalgeirsdóttir, S. S. Drijfhout, T. L. Edwards, N. R. Golledge, M. Hemer, R. E. Kopp, G. Krinner, A. Mix, D. Notz, S. Nowicki, I. S. Nurhati, L. Ruiz, J-B. Sallée, A. B. A. Slangen, Y. Yu, 2021, Ocean, Cryosphere and Sea Level Change. In: Climate Change 2021: The Physical Science Basis. Contribution of Working Group I to the Sixth Assessment Report of the Intergovernmental Panel on Climate Change [Masson-Delmotte, V., P. Zhai, A. Pirani, S. L. Connors, C. Péan, S. Berger, N. Caud, Y. Chen, L. Goldfarb, M. I. Gomis, M. Huang, K. Leitzell, E. Lonnoy, J. B. R. Matthews, T. K. Maycock, T. Waterfield, O. Yelekçi, R. Yu and B. Zhou (eds.)]. Cambridge University Press. In press.
  2. Garner, G. G., R. E. Kopp, T. Hermans, A. B. A. Slangen, G. Koubbe, M. Turilli, S. Jha, T. L. Edwards, A. Levermann, S. Nowikci, M. D. Palmer, C. Smith, in prep. Framework for Assessing Changes To Sea-level (FACTS). Geoscientific Model Development.
  3. Garner, G. G., T. Hermans, R. E. Kopp, A. B. A. Slangen, T. L. Edwards, A. Levermann, S. Nowikci, M. D. Palmer, C. Smith, B. Fox-Kemper, H. T. Hewitt, C. Xiao, G. Aðalgeirsdóttir, S. S. Drijfhout, T. L. Edwards, N. R. Golledge, M. Hemer, R. E. Kopp, G. Krinner, A. Mix, D. Notz, S. Nowicki, I. S. Nurhati, L. Ruiz, J-B. Sallée, Y. Yu, L. Hua, T. Palmer, B. Pearson, 2021. IPCC AR6 Sea-Level Rise Projections. Version 20210809. PO.DAAC, CA, USA. Dataset accessed [2021-08-24] at https://podaac.jpl.nasa.gov/announcements/2021-08-09-Sea-level-projections-from-the-IPCC-6th-Assessment-Report.
  4. We thank the projection authors for developing and making the sea-level rise projections available, multiple funding agencies for supporting the development of the projections, and the NASA Sea-Level Change Team for developing and hosting the IPCC AR6 Sea-Level Projection Tool.