10-Day normals of Air Temperature and Rainfall recorded at the Hong Kong Observatory, 1961-1990
| Date | Air Temperature Figure |
Mean Total Rainfall (mm) Figure |
||
|---|---|---|---|---|
| Mean Maximum (deg.C) |
Mean (deg.C) |
Mean Minimum (deg.C) |
||
| Jan 01-10 | 18.7 | 15.9 | 13.7 | 7.5 |
| Jan 11-20 | 18.5 | 15.6 | 13.3 | 6.0 |
| Jan 21-31 | 18.7 | 15.9 | 13.8 | 9.9 |
| Feb 01-10 | 17.8 | 15.2 | 13.2 | 12.6 |
| Feb 11-20 | 19.3 | 16.5 | 14.5 | 13.6 |
| Feb 21-29 | 18.7 | 16.2 | 14.2 | 21.8 |
| Mar 01-10 | 19.9 | 17.2 | 15.2 | 18.3 |
| Mar 11-20 | 21.7 | 18.8 | 16.8 | 20.2 |
| Mar 21-31 | 22.1 | 19.4 | 17.4 | 28.4 |
| Apr 01-10 | 23.4 | 20.7 | 18.7 | 63.0 |
| Apr 11-20 | 24.8 | 22.1 | 20.1 | 40.1 |
| Apr 21-30 | 26.6 | 23.7 | 21.7 | 58.4 |
| May 01-10 | 28.1 | 25.2 | 23.2 | 73.0 |
| May 11-20 | 28.7 | 25.9 | 23.9 | 121.9 |
| May 21-31 | 29.2 | 26.5 | 24.6 | 121.8 |
| Jun 01-10 | 29.3 | 26.8 | 25.0 | 137.5 |
| Jun 11-20 | 30.4 | 27.9 | 26.0 | 138.6 |
| Jun 21-30 | 31.2 | 28.6 | 26.6 | 99.9 |
| Jul 01-10 | 31.7 | 28.9 | 26.9 | 79.6 |
| Jul 11-20 | 31.7 | 28.8 | 26.6 | 111.4 |
| Jul 21-31 | 31.3 | 28.6 | 26.4 | 132.6 |
| Aug 01-10 | 31.4 | 28.6 | 26.4 | 122.1 |
| Aug 11-20 | 31.3 | 28.4 | 26.2 | 140.2 |
| Aug 21-31 | 31.3 | 28.4 | 26.2 | 129.1 |
| Sep 01-10 | 30.9 | 28.1 | 25.9 | 136.9 |
| Sep 11-20 | 30.6 | 27.8 | 25.6 | 64.7 |
| Sep 21-30 | 29.5 | 26.9 | 24.9 | 98.1 |
| Oct 01-10 | 29.0 | 26.3 | 24.2 | 41.0 |
| Oct 11-20 | 28.1 | 25.4 | 23.4 | 69.6 |
| Oct 21-31 | 26.6 | 24.0 | 22.0 | 34.2 |
| Nov 01-10 | 25.8 | 23.1 | 21.0 | 12.3 |
| Nov 11-20 | 24.1 | 21.5 | 19.3 | 15.5 |
| Nov 21-30 | 22.6 | 19.7 | 17.3 | 7.4 |
| Dec 01-10 | 21.6 | 18.7 | 16.3 | 10.5 |
| Dec 11-20 | 20.4 | 17.6 | 15.3 | 7.3 |
| Dec 21-31 | 19.5 | 16.8 | 14.5 | 9.6 |
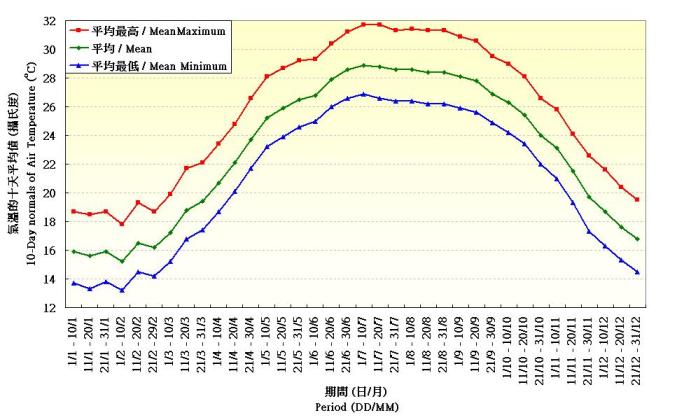
Figure 1. 10-Day normals of Air Temperature recorded at the Hong Kong Observatory(1961-1990)
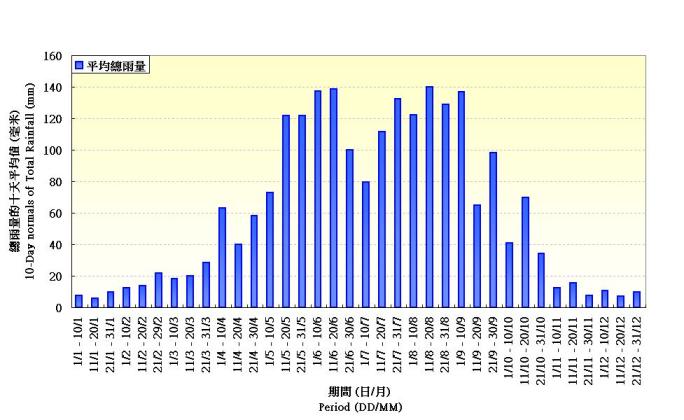
Figure 2. 10-Day normals of Rainfall recorded at the Hong Kong Observatory (1961-1990)