Cherry-picking - a basic trick to distort the truth
28 October 2013
Around April each year, the Arctic warms up and sea ice starts to melt. The annual minimum of the sea ice coverage extent normally occurs in September. From late September to early October, temperature falls, sea ice increases gradually, and the Arctic becomes frozen again. This natural seasonal cycle becomes more vulnerable to the influence of weather as the climate continues to warm.
Arctic sea ice shrank to a record low on 16 September 2012 since the start of satellite observation in 1979[1]. The Arctic was cooler this summer, leading to less sea ice melting. As a result, there was a slight rebound of the Arctic sea ice coverage extent, but to a level still below the long-term average (Figure 1). Nonetheless, climate change deniers seized the opportunity to do their "cherry-picking". They conveniently ignored the record low last year, but instead made a big story out of the relatively less melting this year, even claiming that this was fresh evidence that the globe was in fact cooling!
In an earlier blog article[2], we pointed out that conclusions based on short-term fluctuations while ignoring the long-term trends could be very misleading. In this case, by creating confusion making use of the year-to-year fluctuations of Arctic summer sea ice, the climate change deniers' intention to distort the truth was evident for all to see. To avoid being deceived by cherry-picked data, we need to fully grasp the big picture. Figure 2 shows the variation of Arctic sea ice extent in September over a period of more than 30 years. A long-term decreasing trend is very obvious. Despite the inevitable ups and downs from one year to the next, analysis of the data indicates an overall decreasing rate of about 14% per decade in the extent of Arctic sea ice in the month of September. At the current rate, scientists have warned that an ice-free Arctic Ocean in summer may become a reality by mid-century.
At the end of the day, conclusions drawn in the absence of adequate data cannot stand the test of time. Soon afterwards, the US National Aeronautics and Space Administration announced that the minimum of Arctic sea ice extent this year on 13 September was in fact the sixth lowest on record since the start of satellite-based observation[3]. It begs the question: how on earth a sixth lowest record could be interpreted as the evidence in support of global cooling?
S M Lee
References:
[1] Poles apart: A record-breaking summer and winter
http://nsidc.org/arcticseaicenews/2012/10/poles-apart-a-record-breaking-summer-and-winter
[2] Has global warming stopped?
http://www.hko.gov.hk/blog/en/archives/00000132.htm
[3] Arctic Sea Ice Minimum in 2013 is Sixth Lowest on Record
http://www.nasa.gov/content/goddard/arctic-sea-ice-minimum-in-2013-is-sixth-lowest-on-record
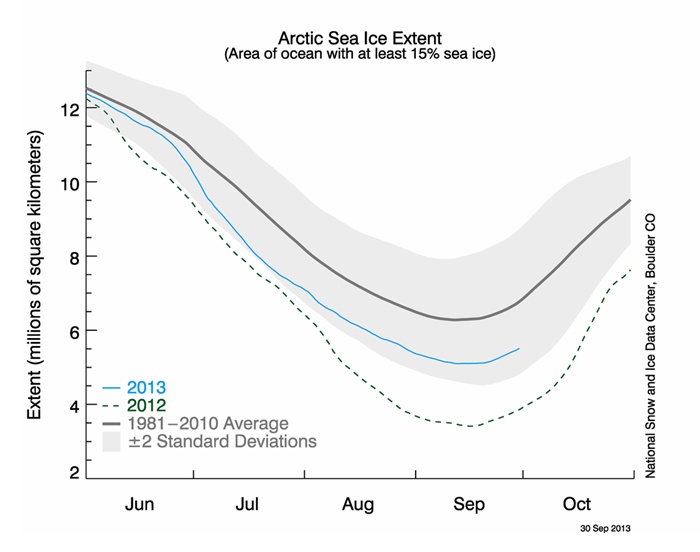
Figure 1Arctic sea ice extent in the summers of 2012 (dashed green line) and 2013 (up to end of September; solid blue line)
in comparison against the long-term average. (Source: US National Snow and Ice Data Center)
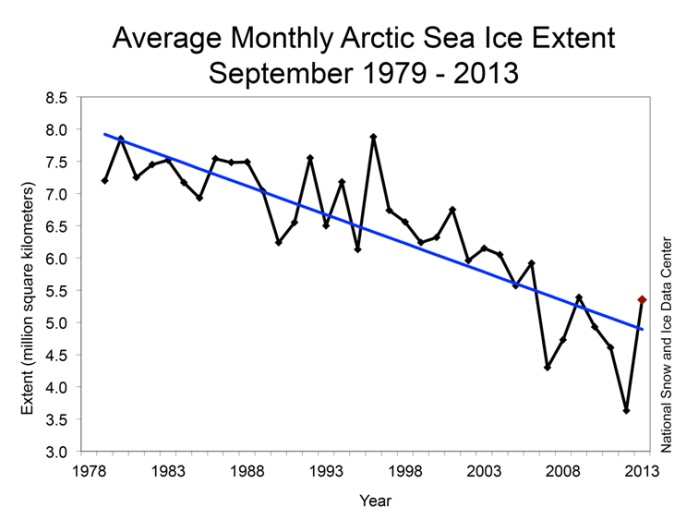
Figure 2Monthly average Arctic sea ice extent for September from 1979 to 2013. The straight blue line shows
the analysed long-term trend. (Source: US National Snow and Ice Data Center)
Arctic sea ice shrank to a record low on 16 September 2012 since the start of satellite observation in 1979[1]. The Arctic was cooler this summer, leading to less sea ice melting. As a result, there was a slight rebound of the Arctic sea ice coverage extent, but to a level still below the long-term average (Figure 1). Nonetheless, climate change deniers seized the opportunity to do their "cherry-picking". They conveniently ignored the record low last year, but instead made a big story out of the relatively less melting this year, even claiming that this was fresh evidence that the globe was in fact cooling!
In an earlier blog article[2], we pointed out that conclusions based on short-term fluctuations while ignoring the long-term trends could be very misleading. In this case, by creating confusion making use of the year-to-year fluctuations of Arctic summer sea ice, the climate change deniers' intention to distort the truth was evident for all to see. To avoid being deceived by cherry-picked data, we need to fully grasp the big picture. Figure 2 shows the variation of Arctic sea ice extent in September over a period of more than 30 years. A long-term decreasing trend is very obvious. Despite the inevitable ups and downs from one year to the next, analysis of the data indicates an overall decreasing rate of about 14% per decade in the extent of Arctic sea ice in the month of September. At the current rate, scientists have warned that an ice-free Arctic Ocean in summer may become a reality by mid-century.
At the end of the day, conclusions drawn in the absence of adequate data cannot stand the test of time. Soon afterwards, the US National Aeronautics and Space Administration announced that the minimum of Arctic sea ice extent this year on 13 September was in fact the sixth lowest on record since the start of satellite-based observation[3]. It begs the question: how on earth a sixth lowest record could be interpreted as the evidence in support of global cooling?
S M Lee
References:
[1] Poles apart: A record-breaking summer and winter
http://nsidc.org/arcticseaicenews/2012/10/poles-apart-a-record-breaking-summer-and-winter
[2] Has global warming stopped?
http://www.hko.gov.hk/blog/en/archives/00000132.htm
[3] Arctic Sea Ice Minimum in 2013 is Sixth Lowest on Record
http://www.nasa.gov/content/goddard/arctic-sea-ice-minimum-in-2013-is-sixth-lowest-on-record
Figure 1Arctic sea ice extent in the summers of 2012 (dashed green line) and 2013 (up to end of September; solid blue line)
in comparison against the long-term average. (Source: US National Snow and Ice Data Center)
Figure 2Monthly average Arctic sea ice extent for September from 1979 to 2013. The straight blue line shows
the analysed long-term trend. (Source: US National Snow and Ice Data Center)