Has global warming stopped?
21 December 2012
As the year 2012 approached its end, the World Meteorological Organization (WMO), in late November, issued a press release on its provisional annual statement on the state of the global climate [1]. According to WMO's analysis, the first ten months of 2012 is the ninth warmest period of January-October since records began in 1850. While the memories of heat waves in the Northern Hemisphere and the record low of Arctic sea ice this year are still fresh to most of us, climate skeptics claimed that the Earth has not warmed for the past 16 years based on monthly temperature data, a very misleading statement and a cherry-picking tactic of deliberately focusing on short-term fluctuations while ignoring the long-term trend in climate change.
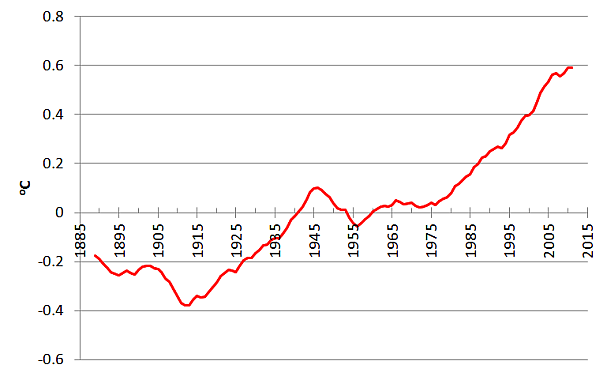
Figure 1Decadal global surface temperature anomaly with reference to the average of 1901-2000 (data source: NCDC)
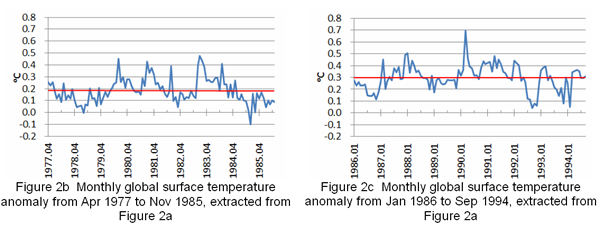
In climate change studies, one way to examine the long-term trend is averaging the data over a relatively long period of time for short-term fluctuations to cancel out. Let us take the data provided by the US National Climate Data Center (NCDC) for illustration. Figure 1 shows the decadal global surface temperature anomaly. The rising trend in recent decades cannot be more clear. Figure 2a shows the monthly global surface temperature anomaly. Fluctuations between months can be large but the overall rising trend is still discernible. However, if we selectively focus on the fluctuations within a short period of time, e.g. Figure 2b and 2c, the depicted trend could be zero or even decreasing.
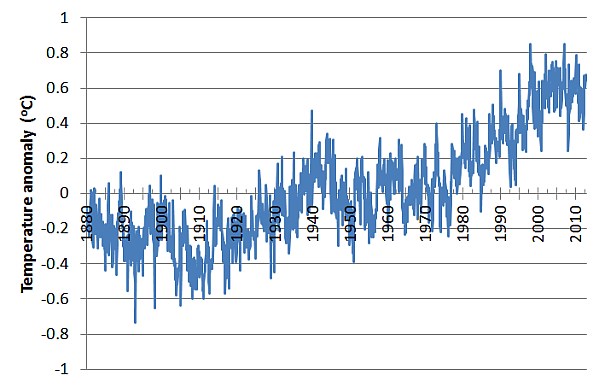
Figure 2aMonthly global surface temperature anomaly with reference to the average of 1901-2000 (data source: NCDC)
Some natural factors such as solar activity, volcanic activity, El Niño and La Niña also influence Earth's surface temperature, albeit in shorter term. Using statistical method, scientists filtered out these short-term influences from temperature data, resulting in a clear long-term rising trend of the Earth's surface temperature in the past 30 years or so (Figure 3).
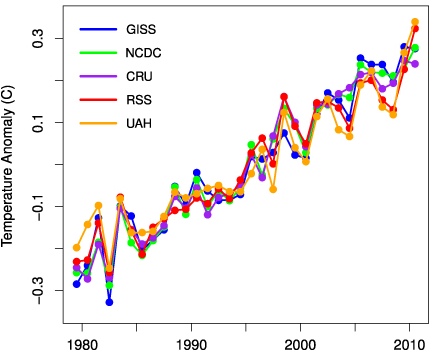
Figure 3Annual global surface temperature anomaly with reference to the average of 1979-2010 after influences of solar activity, volcanic activity, El Niño and La Niña were removed by statistical method. Surface temperature data originate from Goddard Institute for Space Studies, NASA (GISS), US National Climate Data Center (NCDC) and Hadley Centre/Climate Research Unit of the University of East Anglia, UK (CRU). RSS and UAH are satellite data for the lower troposphere. (Image source: Foster G., S. Rahmstorf, 2011: Global Temperature Evolution 1979-2010, Environmental Research Letters 6 (October-December 2011) 044022, http://iopscience.iop.org/1748-9326/6/4/044022/)
The manifestation of global warming is not just rising air temperature. The oceans warm as well. We need to recognize a very important fact: the oceans are much more capable of storing heat energy than the atmosphere. About 90 percent of the heat trapped by greenhouse gases on the Earth is stored in the oceans (Figure 4), and there is no doubt that the global ocean heat content has been rising for the past few decades (Figure 5).
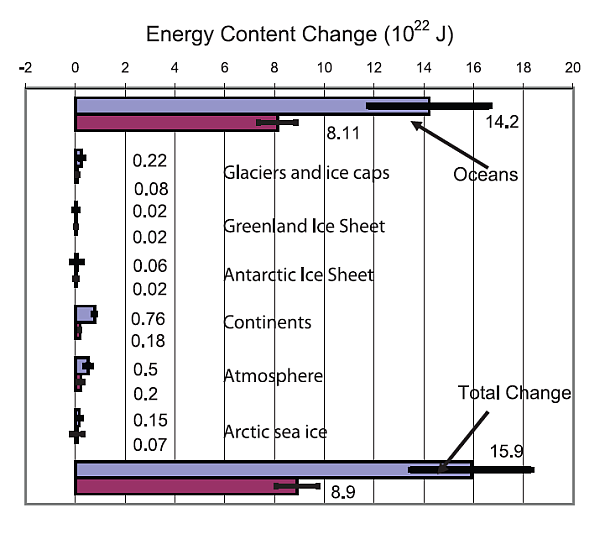
Figure 4Energy content change of different components on Earth for different periods (blue: 1961-2003, burgundy: 1993-2003, thick black line: uncertainty, source: IPCC)
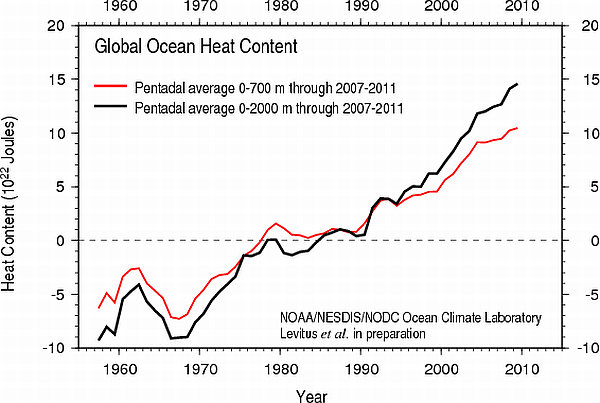
Figure 5Global ocean heat content, reference period being 1955-2006. Red curve is 5-year (pentadal) average of 0-700 m below ocean surface; black curve is 5-year average of 0-2000 m below ocean surface. (source: US National Oceanographic Data Center)
In November 2012, the World Bank published a report entitled "Turn Down the Heat: Why a 4oC Warmer World Must be Avoided" [2], pointing out that the impacts of climate change have already emerged and outlining a range of risks and impacts associated with a 4oC warmer world (relative to the pre-industrial climate): unprecedented heat waves, severe droughts, floods, food security under threat, shortage of water resource, impacts on ecosystems, etc. The report highlighted that if the current mitigation commitments are not met, a warming of 4oC could occur as early as the 2060s. If all the existing mitigation measures are implemented but without further commitment and action, the world is still likely to warm by 3oC within this century.
S M Lee, H W Tong
References:
[1] WMO Provisional Statement on the State of Global Climate in 2012
http://www.wmo.int/pages/mediacentre/press_releases/pr_966_en.html
[2] The World Bank: New Report Examines Risks of 4 Degree Hotter World by End of Century
http://www.worldbank.org/en/news/2012/11/18/new-report-examines-risks-of-degree-hotter-world-by-end-of-century
Figure 1Decadal global surface temperature anomaly with reference to the average of 1901-2000 (data source: NCDC)
In climate change studies, one way to examine the long-term trend is averaging the data over a relatively long period of time for short-term fluctuations to cancel out. Let us take the data provided by the US National Climate Data Center (NCDC) for illustration. Figure 1 shows the decadal global surface temperature anomaly. The rising trend in recent decades cannot be more clear. Figure 2a shows the monthly global surface temperature anomaly. Fluctuations between months can be large but the overall rising trend is still discernible. However, if we selectively focus on the fluctuations within a short period of time, e.g. Figure 2b and 2c, the depicted trend could be zero or even decreasing.
Figure 2aMonthly global surface temperature anomaly with reference to the average of 1901-2000 (data source: NCDC)
Some natural factors such as solar activity, volcanic activity, El Niño and La Niña also influence Earth's surface temperature, albeit in shorter term. Using statistical method, scientists filtered out these short-term influences from temperature data, resulting in a clear long-term rising trend of the Earth's surface temperature in the past 30 years or so (Figure 3).
Figure 3Annual global surface temperature anomaly with reference to the average of 1979-2010 after influences of solar activity, volcanic activity, El Niño and La Niña were removed by statistical method. Surface temperature data originate from Goddard Institute for Space Studies, NASA (GISS), US National Climate Data Center (NCDC) and Hadley Centre/Climate Research Unit of the University of East Anglia, UK (CRU). RSS and UAH are satellite data for the lower troposphere. (Image source: Foster G., S. Rahmstorf, 2011: Global Temperature Evolution 1979-2010, Environmental Research Letters 6 (October-December 2011) 044022, http://iopscience.iop.org/1748-9326/6/4/044022/)
The manifestation of global warming is not just rising air temperature. The oceans warm as well. We need to recognize a very important fact: the oceans are much more capable of storing heat energy than the atmosphere. About 90 percent of the heat trapped by greenhouse gases on the Earth is stored in the oceans (Figure 4), and there is no doubt that the global ocean heat content has been rising for the past few decades (Figure 5).
Figure 4Energy content change of different components on Earth for different periods (blue: 1961-2003, burgundy: 1993-2003, thick black line: uncertainty, source: IPCC)
Figure 5Global ocean heat content, reference period being 1955-2006. Red curve is 5-year (pentadal) average of 0-700 m below ocean surface; black curve is 5-year average of 0-2000 m below ocean surface. (source: US National Oceanographic Data Center)
In November 2012, the World Bank published a report entitled "Turn Down the Heat: Why a 4oC Warmer World Must be Avoided" [2], pointing out that the impacts of climate change have already emerged and outlining a range of risks and impacts associated with a 4oC warmer world (relative to the pre-industrial climate): unprecedented heat waves, severe droughts, floods, food security under threat, shortage of water resource, impacts on ecosystems, etc. The report highlighted that if the current mitigation commitments are not met, a warming of 4oC could occur as early as the 2060s. If all the existing mitigation measures are implemented but without further commitment and action, the world is still likely to warm by 3oC within this century.
S M Lee, H W Tong
References:
[1] WMO Provisional Statement on the State of Global Climate in 2012
http://www.wmo.int/pages/mediacentre/press_releases/pr_966_en.html
[2] The World Bank: New Report Examines Risks of 4 Degree Hotter World by End of Century
http://www.worldbank.org/en/news/2012/11/18/new-report-examines-risks-of-degree-hotter-world-by-end-of-century