Weather Information for Aviation Sports

Weather of Hot Spots for Aerial Sports
Tsim Sha Tsui
(looking towards the east)
(looking towards the east)

Variation of 10-minute Mean Wind Direction and Speed Map
24-hour Time Series of 10-minute Mean Wind Speed ( ___ ), 10-minute Maximum Gust ( - ) and
Maximum Gust minus Mean Wind Speed ( )
)
Maximum Gust minus Mean Wind Speed (
)

24-hour Time Series of 10-minute Mean Wind Direction ( ___ )

HKO
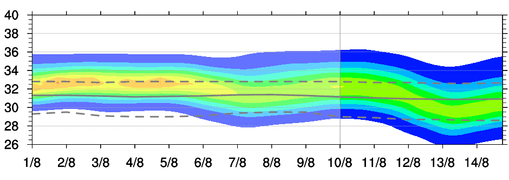
The figure following symbols  and
and  are the forecast/recorded temperature at HKO on the day, and could be regarded as the range of temperature variation on that day.
and are the forecast/recorded temperature at HKO on the day, and could be regarded as the range of temperature variation on that day.°C
%

Thermal Index 
|
|||||||||||||||||||||||
|
|||||||||||||||||||||||
")
")
")
")
")
| Soaring Index
(Soaring Conditions) |
The Soaring Index is commonly calculated using weather information between 5000 feet ( 1524 meters ) and 20000 feet ( 6096 meters ) to measure the lift offered by convective clouds. |
Weather Forecast for Local Aviation