Background Information

Background Information
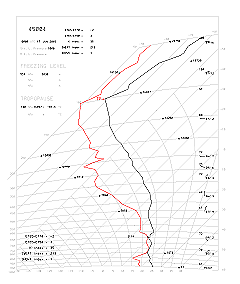 |
| Figure 1. A sample tephigram |
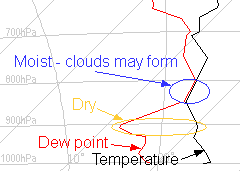 |
| Figure 2. A magnified sample tephigram showing the place where air is dry and the place where air is wet |
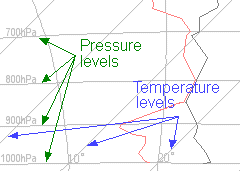 |
| Figure 3. A magnified sample tephigram showing the location of temperature and pressure levels |
Upper air observations made by a radiosonde attached to a weather balloon are used in the estimation of soaring conditions.
To analyse these observations, meteorologists usually plot temperatures and dew points# observed at different heights on a diagram known as a tephigram. A sample tephigram is shown in Figure 1.
On a magnified tephigram (Figure 2), temperatures are plotted in black while dew points are plotted in red. When the black and red lines are far apart, it means that the air is dry. When the two lines come very close together, it means that the air is moist and clouds are expected to form.
There are several things to note when interpreting a tephigram. First, heights are represented in pressure units on a tephigram. The table below shows the relationship between pressure and height in a standard atmosphere*:
| Pressure | Height above mean sea level |
|---|---|
| 500hPa | 18 289ft (5 574m) |
| 700hPa | 9 882ft (3 012m) |
| 850hPa | 4 781ft (1 457m) |
| 1 000hPa | 364ft (111m) |
Second, different pressure levels are represented by nearly horizontal lines on the tephigram while constant temperature levels are straight lines tilted at 45 degrees from the vertical (Figure 3).
There are several ways to estimate soaring conditions. Thermal Index and Soaring Index are the most commonly used indices.
The following formula defines Thermal Index TH at a point H metres above the ground surface+:
| TH = | TemperatureH - TemperatureSurface + 0.00976 x H |
where TemperatureSurface and TemperatureH are in degrees Celsius measured near the ground and at H metres above the ground respectively.
The Soaring Index S is defined as+:
| S = | Temperature850 - Temperature500 + Dew point850 - Temperature700 + Dew point700 |
where Temperature500, Temperature700/Dew point700 and Temperature850/Dew point850 are in degrees Celsius at 500, 700 and 850hPa respectively.
| # | When an air parcel is cooled, at a certain temperature it will become saturated. Such a temperature is called the dew point. A large difference between temperature and dew point indicates that the air at that level is dry, whereas a small difference indicates that the air is moist. |
| * | Manual of the ICAO Standard Atmosphere (Third Edition - 1993) - Doc 7488/3 |
| + | Handbook of Meteorological Forecasting for Soaring Flight. World Meteorological Organization Technical Note No.158. (WMO - No.495). |