The Year's Weather - 2014
7 January 2015
Globally, according to the World Meteorological Organizations preliminary assessment based on the global average temperature from January to October, 2014 is likely to be one of the hottest years since global records began in 1850. Moreover, notable extreme weather events wreaked havoc in many parts of the world in 2014, including heat waves in South Africa, Australia and Argentina, exceptional cold weather in the Mid-West and the Mississippi River of the United States, heavy snow in northern and eastern Japan, and Buffalo and New York of the United States, severe drought in northern China, parts of eastern and central Brazil, western United States, New South Wales and Queensland of Australia, and the North-West Province of South Africa, extreme rainfall and flooding in United Kingdom, Balkan Peninsula, France, parts of southern Russia, parts of South Africa, Mozambique, Morocco, Japan, Nepal, northern Bangladesh, northern Pakistan and India, Argentina, Paraguay, and parts of the United States, Super Typhoon Rammasun in the Philippines and Hainan Province of China, Very Severe Cyclonic Storm Hud Hud and Nilfar in India as well as Typhoons Nakri and Halong in western Japan. Over the central and eastern equatorial Pacific, the sea surface temperature has remained above the normal range from May to October and an El Ni?o event has been established. The minimum Arctic sea ice extent in September 2014 was the sixth lowest on record.
In Hong Kong, the weather overall in 2014 was warmer than usual. Despite it was cooler in February, March and December, the weather was unusually hot from June to September and very warm in October and November. As for the whole year, the annual average temperature of 23.5 degrees was 0.2 degrees above the 1981-2010 normal[1] (or 0.5 degrees above the 1961-1990 normal of 23.0 degrees), ranking the ninth highest on record. Regarding extreme temperatures, there were 33 Very Hot Days[2] and 34 Hot Nights[3] in 2014, about 23 and 16 days more than the 1981-2010 normal figures respectively and both ranking the second highest since record began in 1884. The number of Cold Days[4] in the year was 21 days, four days above normal. In 2014, the maximum temperature recorded at the Hong Kong Observatory was 34.6 degrees on 1 August, and the minimum temperature recorded was 7.3 degrees on 12 February.
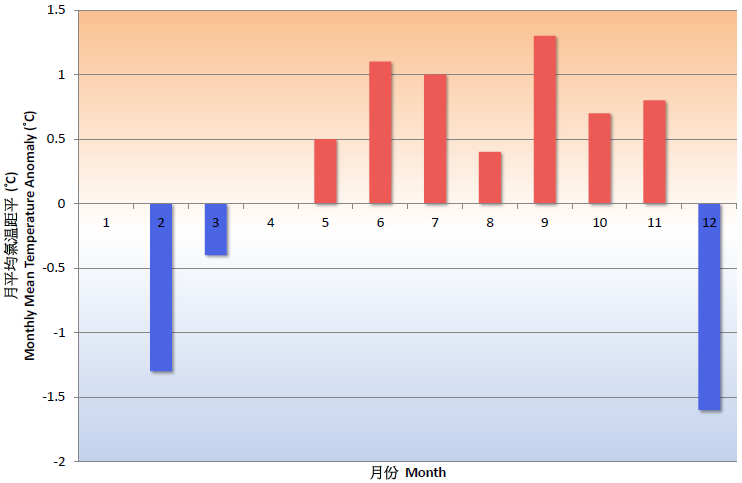
Fig. 1 Monthly mean temperature anomalies in Hong Kong in 2014
With unsettled weather and well above normal rainfall in March, May and August, 2014 was also a wet and thundery year. The annual total rainfall was 2638.3 millimetres, a surplus of 10 percent comparing to the 1981-2010 normal of 2398.5 millimetres (and about 19 percent above the 1961-1990 normal). The total number of days with thunderstorms reported at the Hong Kong Observatory was 59 days. It is the highest since records began in 1947, shattering the previous record of 53 days set in 1997 and 2013. Affected by troughs of low pressure, there were torrential rain and intense thunderstorms in Hong Kong on 30 March and 8 May, requiring the Observatory to issue the Black Rainstorm Warning. The intense thunderstorms on 30 March also brought widespread hail and severe squalls to the territory.
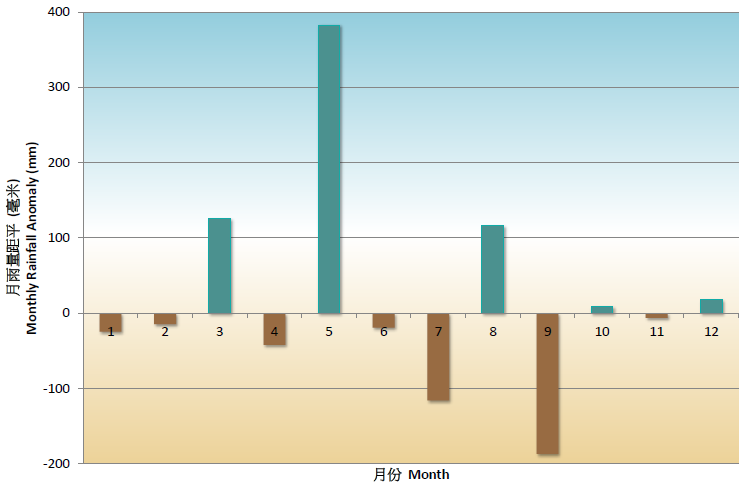
Fig. 2 Monthly rainfall anomalies in Hong Kong in 2014
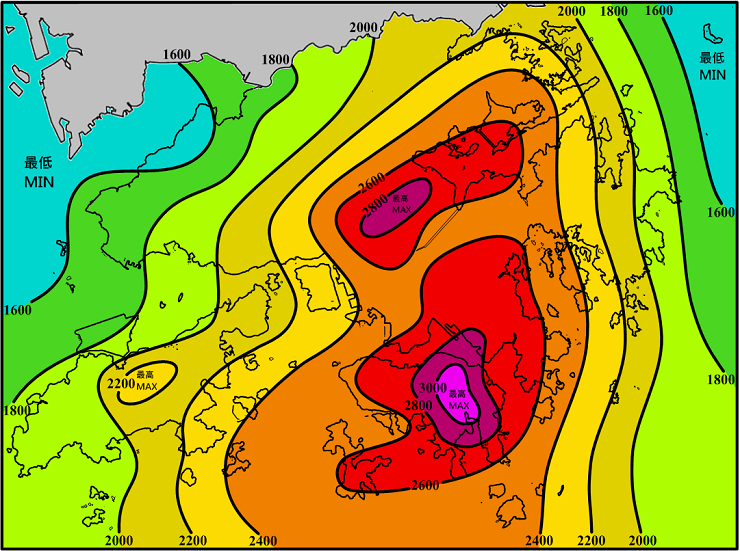
Fig. 3 Annual Rainfall Distribution in Hong Kong in 2014
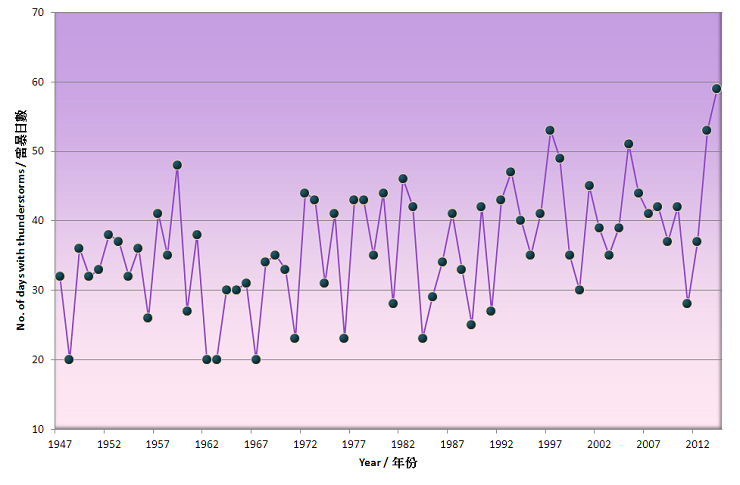
Fig. 4 Long term trend of thunderstorm days as observed at the Hong Kong Observatory since 1947
A total of 24 tropical cyclones occurred over the western North Pacific and the South China Sea in 2014, less than the long term (1961-2010) average of around 30. There were 11 tropical cyclones reaching typhoon intensity[5] or above during the year, below the long term average of about 15. In Hong Kong, four tropical cyclones necessitated the issuance of local tropical cyclone warning signals, lower than the long term average of about six in a year. The No. 8 Gale or Storm Signal was issued during the passage of Typhoon Kalmaegi in September.

Fig. 5 A scaffolding at Ta Chuen Ping Street of Kwai Chung collapsed, damaging a lorry and a minibus during the passage of Typhoon Kalmaegi. (Photo courtesy of Sing Tao Daily)
Detailed descriptions of the weather for individual months are available in the Monthly Weather Summary webpage from the following URL: http://www.hko.gov.hk/wxinfo/pastwx/mws.htm
Some significant weather events in Hong Kong in 2014 are highlighted below:
Black Rainstorms in March and May
On 30 March, an active trough of low pressure brought heavy rain and intense thunderstorms to Hong Kong in the evening. Over a period of 3 to 4 hours, more than 100 millimetres of rainfall were recorded in Kowloon and the New Territories. Rainfall in Yuen Long, Tuen Mun, Tsuen Wan and Shatin exceeded 150 millimetres. The hourly rainfall of 56 millimetres recorded at the Hong Kong Observatory between 9 and 10 p.m. on 30 March was the highest in March since record began in 1884. The Black Rainstorm Warning was issued at 8:40 p.m., the first time in March since the Rainstorm Warning System commenced operation in 1992. There were flooding reports in Kowloon and the New Territories including the MTR stations at Kowloon Tong and Wong Tai Sin. Intense thunderstorms also brought widespread hail and severe squalls to the territory. A maximum gust exceeding 130 kilometres per hour was reported at Lau Fau Shan, and one person was injured as stacked containers at the Kwai Chung Container Terminals toppled over.
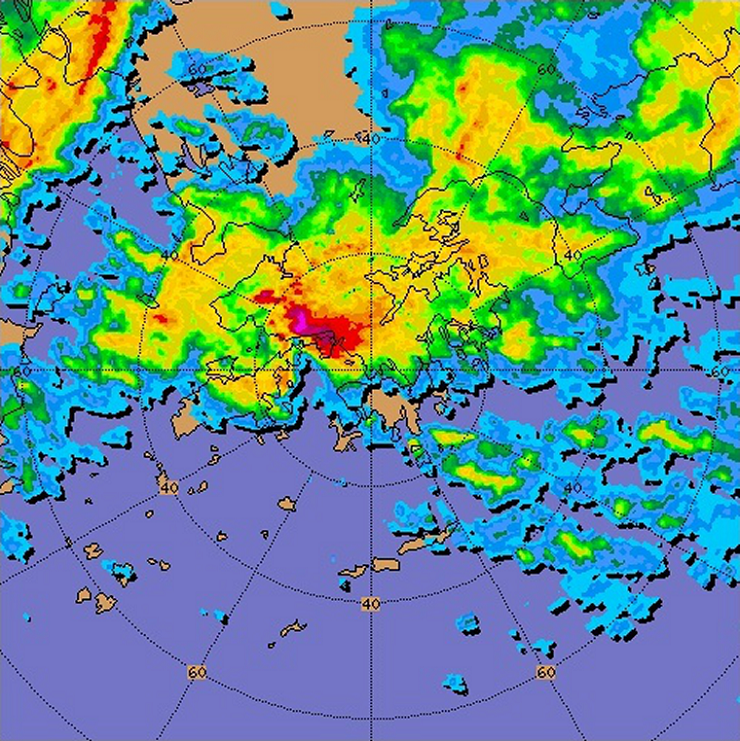
Fig. 6 Radar image showing heavy rain and hail-bearing thunderstorms crossing the territory at 8:00 p.m. on 30 March 2014

Fig. 7 A hail stone picked up in Tsuen Wan at around 8:40 p.m. on 30 March 2014
(Courtesy of Ms Susanna Cheung)
On 8 May, an active trough of low pressure swept across the coast of Guangdong at night and brought widespread heavy rain and squally thunderstorms to Hong Kong. The Black Rainstorm Warning was issued at 10:30 p.m. and more than 70 millimetres of rainfall were generally recorded over the territory. Affected by troughs of low pressure near the south China coastal areas, the weather remained unsettled with outbreaks of heavy showers and squally thunderstorms in the next few days. The rain was particularly heavy and persistent over the northern part of the New Territories on 11 May with more than 200 millimetres of rainfall recorded over Tai Po, Sha Tau Kok and Sheung Shui
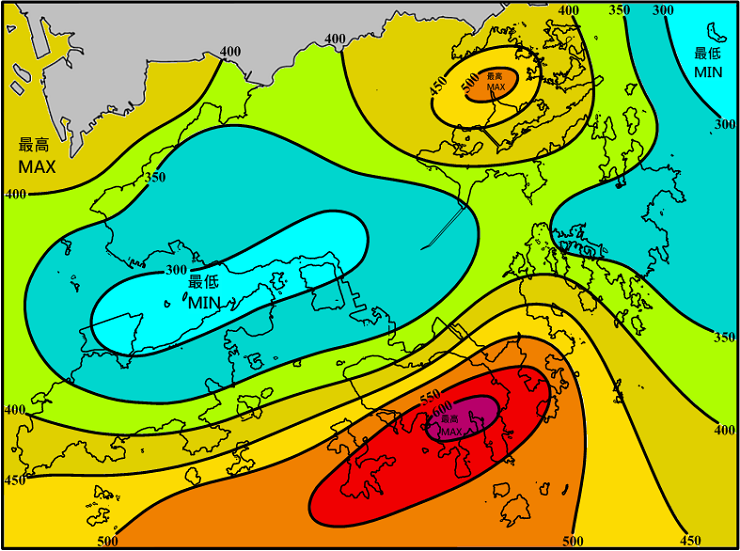
Fig. 8 Rainfall Distribution in Hong Kong during 8-12 May 2014
Unusually High Temperatures in Summer and Autumn
Affected by the stronger than normal subtropical ridge over southern China and the higher than normal sea surface temperature in the northern part of the South China Sea, the weather in Hong Kong was unusually hot from June to September this year. Moreover, dominated by relatively weak northeast monsoon for most of the time, October and November were also significantly warmer than usual. The mean temperature for June to November recorded at the Hong Kong Observatory in 2014 was 27.6 degrees, the highest for the same period since record began in 1884. In particular, the monthly mean temperatures of 29.0 degrees, 29.8 degrees and 29.0 degrees respectively for June, July and September also emerged as the record high for individual months.
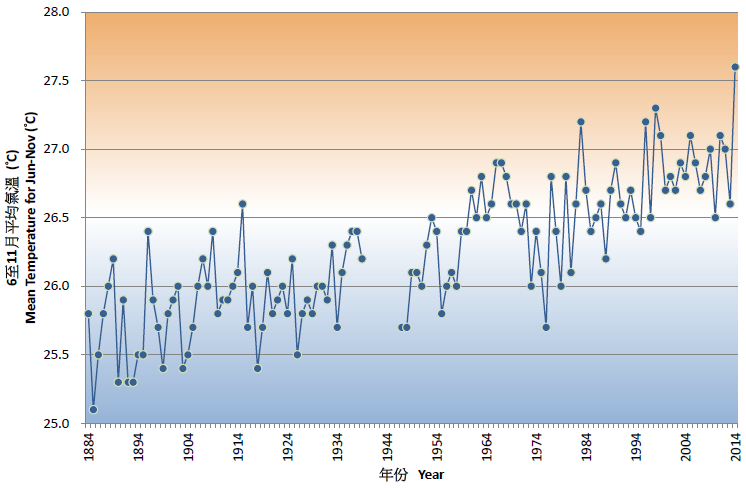
Fig. 9 Long Term Trend of Mean Temperature for June to November recorded at the Hong Kong Observatory
No tropical cyclone formed in August
There was no tropical cyclones formed over the western North Pacific and the South China Sea in August, much less than the long term (1961-2010) average of about six. The lower than normal tropical cyclone activity is mainly attributed to the significantly weaker southwest monsoon and the stronger and relatively south subtropical ridge which suppressed the development of tropical cyclones over the region.
Note :
[1] Climatological normals for the reference period of 1961-1990, 1971-2000 and 1981-2010 are available at : http://www.weather.gov.hk/cis/normal_e.htm. Climatological normals of 1981-2010 are referenced in the text unless otherwise stated.
[2] 'Very Hot Day' refers to the condition with the daily maximum temperature equal to or higher than 33.0 degrees.
[3] 'Hot Night' refers to the condition with the daily minimum temperature equal to or higher than 28.0 degrees.
[4] 'Cold Day' refers to the condition with the daily minimum temperature equal to or lower than 12.0 degrees.
[5] Information on the classification of tropical cyclones is available at: http://www.hko.gov.hk/informtc/class.htm.
| Month | Mean Pressure (hPa) |
Air Temperature | Mean Dew Point (deg. C) |
Mean Relative Humidity (%) |
Mean Amount of Cloud (%) |
Total Rainfall (mm) |
||
|---|---|---|---|---|---|---|---|---|
| Mean Daily Max. (deg. C) |
Mean (deg. C) |
Mean Daily Min. (deg. C) |
||||||
| Jan | 1021.3 | 19.2 | 16.3 | 14.1 | 9.9 | 67 | 32 | Trace |
| Feb | 1017.7 | 17.9 | 15.5 | 13.5 | 12.3 | 82 | 73 | 39.5 |
| Mar | 1017.1 | 20.9 | 18.7 | 17.0 | 15.7 | 83 | 77 | 207.6 |
| Apr | 1013.4 | 24.9 | 22.6 | 21.0 | 20.0 | 86 | 72 | 132.4 |
| May | 1009.5 | 28.6 | 26.4 | 24.6 | 23.7 | 86 | 82 | 687.3 |
| Jun | 1003.8 | 31.5 | 29.0 | 27.0 | 25.0 | 80 | 77 | 436.6 |
| Jul | 1005.3 | 32.6 | 29.8 | 27.6 | 25.9 | 80 | 70 | 260.5 |
| Aug | 1007.0 | 32.0 | 29.0 | 26.8 | 25.3 | 81 | 67 | 548.2 |
| Sep | 1008.4 | 32.0 | 29.0 | 27.0 | 24.5 | 77 | 57 | 140.6 |
| Oct | 1014.6 | 28.9 | 26.2 | 24.3 | 20.4 | 71 | 54 | 109.8 |
| Nov | 1017.0 | 24.6 | 22.6 | 21.2 | 18.5 | 78 | 63 | 31.1 |
| Dec | 1021.7 | 18.5 | 16.3 | 14.2 | 9.9 | 67 | 67 | 44.7 |
| Mean/Total | 1013.1 | 26.0 | 23.5 | 21.5 | 19.3 | 78 | 66 | 2638.3 |
| Normal* | 1012.9 | 25.6 | 23.3 | 21.4 | 19.0 | 78 | 68 | 2398.5 |
| Station | Hong Kong Observatory | |||||||
| Month | Number of hours of Reduced Visibility# (hours) |
Total Bright Sunshine (hours) |
Mean Daily Global Solar Radiation (MJ/m2) |
Total Evaporation (mm) |
Prevailing Wind Direction (degrees) |
Mean Wind Speed (km/h) |
|
|---|---|---|---|---|---|---|---|
| Jan | 148 | 231 | 238.8 | 14.76 | 89.3 | 040 | 22.9 |
| Feb | 49 | 58 | 91.9 | 10.08 | 59.8 | 050 | 26.6 |
| Mar | 124 | 59 | 86.0 | 9.58 | 72.0& | 060 | 24.1 |
| Apr | 111 | 75 | 119.4 | 12.95 | 82.3& | 080 | 20.6 |
| May | 4 | 11 | 107.8 | 12.94 | 90.0& | 240 | 23.7 |
| Jun | 17 | 17 | 147.3 | 15.78 | 127.7& | 230 | 18.8 |
| Jul | 19 | 14 | 217.5 | 19.31 | 159.8& | 220 | 18.2 |
| Aug | 0 | 0 | 212.0 | 18.59 | 135.4& | 240 | 17.7 |
| Sep | 27 | 34 | 203.0 | 16.49 | 129.7& | 080 | 17.4 |
| Oct | 63 | 81 | 222.9 | 16.30 | 146.4 | 100 | 24.3 |
| Nov | 34 | 108 | 141.4 | 10.98 | 85.7 | 090 | 25.0 |
| Dec | 26 | 115 | 115.3 | 9.41 | 85.8 | 020 | 30.5 |
| Mean/ Total |
622 | 803 | 1903.3 | 13.93 | 1263.9& | 070 | 22.5 |
| Normal* | 692.3 | 1379.3§ | 1835.6 | 12.85 | 1227.3 | 080 | 23.3 |
| Station | Hong Kong Observatory |
Hong Kong International Airport |
King's Park | Waglan Island^ | |||
| Month | Number of Very Hot Day | Number of Hot Night | Number of Cold Day | Number of days with thunderstorms |
|---|---|---|---|---|
| Jan | - | - | 6 | - |
| Feb | - | - | 9 | - |
| Mar | - | - | - | 3 |
| Apr | - | - | - | 3 |
| May | - | 3 | - | 14 |
| Jun | 5 | 8 | - | 10 |
| Jul | 15 | 13 | - | 9 |
| Aug | 6 | 6 | - | 11 |
| Sep | 7 | 4 | - | 5 |
| Oct | - | - | - | 4 |
| Nov | - | - | - | - |
| Dec | - | - | 6 | - |
| Total | 33 | 34 | 21 | 59 |
| Normal* | 10.2 | 17.8 | 17.1 | 38.6 |
| Station | Hong Kong Observatory | |||
The minimum pressure recorded at the Hong Kong Observatory was 997.2 hectopascals at 1650 HKT on 23 July.
The maximum air temperature recorded at the Hong Kong Observatory was 34.6 degrees C at 1519 HKT on 1 August.
The minimum air temperature recorded at the Hong Kong Observatory was 7.3 degrees C at 0705 HKT on 12 February.
The maximum gust peak speed recorded at Waglan Island was 112 kilometres per hour from 090 degrees at 0015 HKT on 16 September.
The maximum instantaneous rate of rainfall recorded at the Hong Kong Observatory was 374 millimetres per hour at 2035 HKT on 30 March.
# Reduced visibility refers to visibility below 8 kilometres when there is no fog, mist, or precipitation.
- The visibility readings at the Hong Kong International Airport are based on hourly observations by professional meteorological observers in 2004 and before, and average readings over the 10-minute period before the clock hour of the visibility meter near the middle of the south runway from 2005 onwards. The change of the data source in 2005 is an improvement of the visibility assessment using instrumented observations following the international trend.
- Before 10 October 2007, the number of hours of reduced visibility at the Hong Kong International Airport in 2005 and thereafter displayed in this web page was based on hourly visibility observations by professional meteorological observers. Since 10 October 2007, the data have been revised using the average visibility readings over the 10-minute period before the clock hour, as recorded by the visibility meter near the middle of the south runway.
* 1981-2010 Climatological Normal, unless otherwise specified
§ 1997-2013 Mean value
& data incomplete
^ In case the data are not available from Waglan Island, observations of Cheung Chau or other nearby weather stations will be incorporated in computing the Prevailing Wind Direction and Mean Wind Speed