The Year's Weather - 2013
Globally, a preliminary assessment of the global average temperature from January to November suggests that 2013 is likely to be among the ten warmest years since global records began in 1850. Moreover, there were numerous significant weather events around the world in 2013, including heat waves in Australia, Austria, Pakistan and southern China, severe drought in Brazil, New Zealand, southern Africa and southern China, extreme rainfall and flooding in Queensland and New South Wales of Australia, Mozambique, Argentina, Alpine region of Europe, southern England, Poland, Czech Republic, Russia and India, heavy snow in the northern parts of the United Kingdom, the contiguous United States and the Middle East, Super Typhoon Usagi in southern China, Super Typhoon Haiyan in the Philippines, Very Severe Cyclonic Storm Phailin in India as well as torrential rain induced by tropical cyclones in Mexico, Japan, the Philippines, Vietnam and Cambodia. With sea surface temperature over the central and equatorial Pacific remaining largely normal, there was no significant La Nina or El Nino development in 2013.
Overall, the average temperature in Hong Kong in 2013 was 23.3 degrees, on par with the 1981-2010 normal[1] (or 0.3 degrees above the 1961-1990 normal of 23.0 degrees). The year began with significantly warmer-than-normal weather in the first three months. In particular, under the influence of mild easterly maritime airstreams, the mean temperature of February-March was 1.9 degrees above normal and ranked the fifth highest on record for the same period. However, this warm anomaly was counter-balanced by the cooler weather in April, July and December with monthly mean temperatures 1.1, 0.8 and 1.8 degrees below normal respectively. Affected by the rainy and gloomier weather in July and August, there were only ten Hot Nights[2] in the year, about seven days below normal. Regarding extreme temperatures, there were 17 Very Hot Days[3] in 2013, about seven days more than the 1981-2010 normal figure. The number of Cold Days[4] in the year was 14 days, about three days below normal. In 2013, the maximum temperature recorded at the Hong Kong Observatory was 34.9 degrees on 12 August, and the minimum temperature recorded was 9.2 degrees on 18 December.
Associated with the heavy rain episodes in the unsettled and stormy summer months, 2013 was also a wet and thundery year. The annual total rainfall was 2847.3 millimetres, a surplus of about 19 percent comparing to the 1981-2010 normal of 2398.5 millimetres (and about 29 percent above the 1961-1990 normal), and the total number of days with thunderstorms reported at the Hong Kong Observatory was 53 days, the highest since records began in 1947, tied with the record set in 1997. A trough of low pressure brought torrential rain and intense thunderstorms to Hong Kong on 22 May, necessitating the issuance of Black Rainstorm Warning by the Hong Kong Observatory, the first time since July 2010.
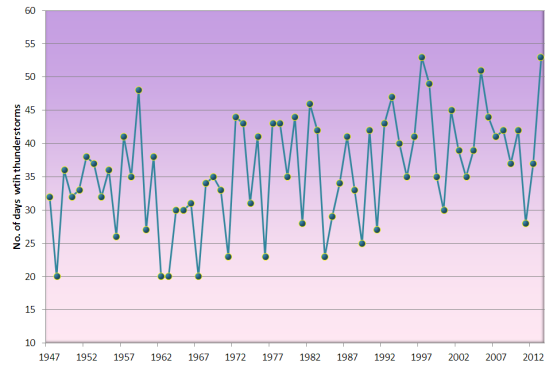
Fig. 1 Long term trend of thunderstorm days as observed
at the Hong Kong Observatory since 1947
A total of 33 tropical cyclones occurred over the western North Pacific and the South China Sea in 2013, more than the long term (1961-2010) average of around 30. There were 14 tropical cyclones reaching typhoon intensity[5] or above during the year, slightly below the long term average of about 15. In Hong Kong, seven tropical cyclones necessitated the issuance of local tropical cyclone warning signals, slightly higher than the long term average of about six in a year. The No. 8 Gale or Storm Signal was issued during the passage of Super Typhoons Utor and Usagi in August and September respectively, of which Usagi was also the most intense tropical cyclone affecting Hong Kong in 2013. Furthermore, Severe Typhoon Krosa was the first tropical cyclone that necessitated the issuance of tropical cyclone warning signals in November since 2006.
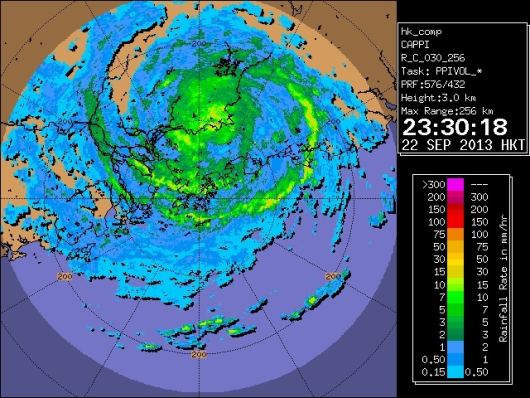
Fig. 2 Radar echoes showing Usagi skirting within 100 kilometres
to the north of Hong Kong on the night of 22 September 2013
Detailed descriptions of the weather for individual months are available in the Monthly Weather Summary webpage from the following URL: http://www.hko.gov.hk/wxinfo/pastwx/mws.htm
Some significant weather events in Hong Kong in 2013 are highlighted below:
Exceptionally Warm in February
Under the influence of mild easterly airstreams for most part of the month, Hong Kong experienced unseasonably warm weather in February 2013. The monthly mean maximum temperature of 22.1 degrees and the mean temperature of 19.1 degrees were more than two degrees above normal and were respectively the second and fourth highest on record for February since records began in 1884.
A Cool Start in May
Affected by an intense northeast monsoon, the weather in Hong Kong was significantly cooler in early May. Temperatures at the Hong Kong Observatory fell to a minimum of 16.6 degrees on the morning of 2 May 2013, the second lowest for May since records began in 1884.
Very Hot in June
June 2013 was hotter than usual with five Very Hot Days[2], four days more than normal. The maximum temperature of 34.2 degrees recorded at the Hong Kong Observatory on 20 June 2013 was the fifth highest for June since records began in 1884.
A Thundery July
July 2013 was rather unstable and thundery under the influence of active maritime airstreams and troughs of low pressure. The total number of days with thunderstorms reported at the Hong Kong Observatory in the month was 14 days, the highest since records began in 1947, tied with the record set in 1995.
High Temperatures caused by Super Typhoon Usagi in September
Under the influence of a subsiding continental airstream associated with the outer circulation of Super Typhoon Usagi, it was very hot in Hong Kong on 21 September 2013. The daily mean temperature was 31.2 degrees at the Hong Kong Observatory, the highest for September since records began in 1884, tied with the records set on 22 September 2008 and 1 September 2010. The maximum temperature at the Hong Kong Observatory that day was 34.7 degrees, the second highest for September.
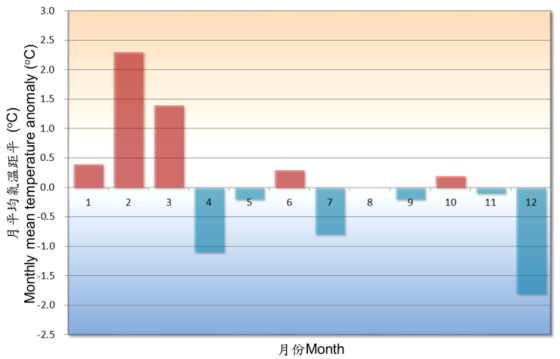
Fig. 3 Monthly mean temperature anomalies in Hong Kong in 2013
Heavy Rain Episodes in May and September
A rather unsettled and stormy summer was accentuated by a couple of heavy rain episodes. A trough of low pressure brought torrential rain and intense thunderstorms to Hong Kong starting from the small hours of 22 May 2013. More than 150 millimetres of rainfall were recorded in many places over the territory. The daily rainfall recorded at the Hong Kong Observatory that day was 230.8 millimetres, the 10th highest daily rainfall for May on record. In early September, an easterly airstream converged with a southerly airstream near Hong Kong and brought heavy rain on 5 September 2013. A total of 197.7 millimetres of rainfall was recorded at the Hong Kong Observatory that day, the 11th highest daily rainfall for September on record.
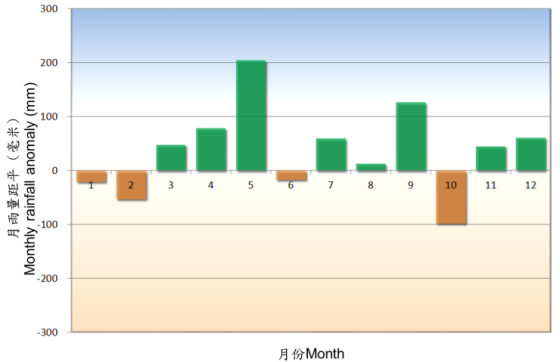
Fig. 4 Monthly rainfall anomalies in Hong Kong in 2013
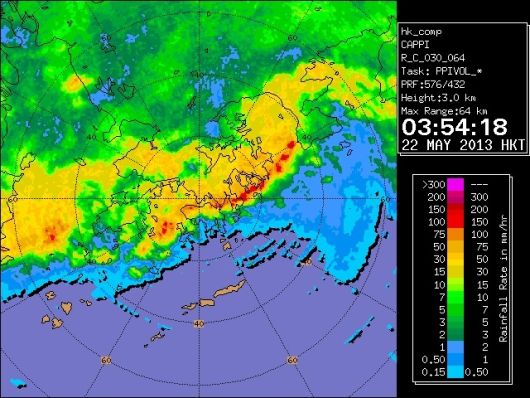
Fig. 5 Radar echoes captured at 3:54 am on 22 May 2013 showing torrential rain
and intense thunderstorms moving across the territory

Fig. 6 Severe landslide in Sau Mau Ping on 22 May 2013
(Photo courtesy of Apple Daily)
An Exceptionally Dry October
Under the dominance of a dry continental air mass for most part of the month, October was drier than usual. The monthly mean relative humidity of 66 percent was the third lowest for October since 1961.
A Chilly and Wet December
Under the influence of cold spells brought by the winter monsoon during the second half of the month, December 2013 was significantly colder than usual. The monthly mean temperature of 16.1 degrees was 1.8 degrees below the normal figure of 17.9 degrees, the lowest for December since 1975. Affected by the rainy episode between 14 and 17 December, the month was also much wetter than usual. The monthly total rainfall of 88.3 millimetres was the tenth highest for December since records began in 1884.
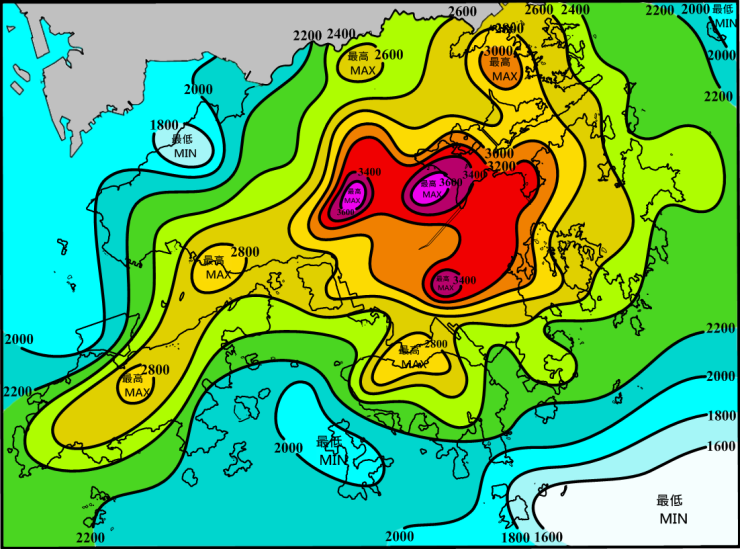
Fig. 7 Annual rainfall distribution in Hong Kong in 2013
Note :
[1] Climatological normals for the reference period of 1961-1990, 1971-2000 and 1981-2010 are available at : http://www.weather.gov.hk/cis/normal_e.htm. Climatological normals of 1981-2010 are referenced in the text unless otherwise stated.
[2] 'Hot Night' refers to the condition with the daily minimum temperature equal to or higher than 28.0 degrees.
[3] 'Very Hot Day' refers to the condition with the daily maximum temperature equal to or higher than 33.0 degrees.
[4] 'Cold Day' refers to the condition with the daily minimum temperature equal to or lower than 12.0 degrees.
[5] Information on the classification of tropical cyclones is available at: http://www.hko.gov.hk/informtc/class.htm.
 Month |
 Mean Pressure (hPa) |
Air Temperature |  Mean Dew Point (deg. C) |
 Mean Relative Humidity (%) |
 Mean Amount of Cloud (%) |
 Total Rainfall (mm) |
||
|---|---|---|---|---|---|---|---|---|
 Mean Daily Maximum (deg. C) |
 Mean (deg. C) |
 Mean Daily Minimum (deg. C) |
||||||
| January | 1020.5 | 19.1 | 16.7 | 14.8 | 11.3 | 71 | 58 | 3.4 |
| February | 1018.3 | 22.1 | 19.1 | 17.1 | 15.4 | 80 | 75 | 1.5 |
| March | 1015.7 | 23.5 | 20.5 | 18.5 | 16.5 | 79 | 65 | 130.5 |
| April | 1012.3 | 23.9 | 21.5 | 19.7 | 19.0 | 86 | 81 | 253.8 |
| May | 1008.8 | 28.2 | 25.7 | 23.9 | 23.2 | 86 | 80 | 509.3 |
| June | 1005.5 | 30.7 | 28.2 | 26.5 | 25.1 | 84 | 72 | 438.6 |
| July | 1007.1 | 30.9 | 28.0 | 26.1 | 25.1 | 85 | 72 | 436.3 |
| August | 1004.9 | 31.1 | 28.6 | 26.5 | 25.3 | 83 | 68 | 445.4 |
| September | 1008.5 | 30.3 | 27.5 | 25.7 | 23.9 | 82 | 67 | 454.2 |
| October | 1014.1 | 28.6 | 25.7 | 23.7 | 18.6 | 66 | 45 | 2.9 |
| November | 1017.3 | 23.8 | 21.7 | 19.7 | 16.2 | 72 | 67 | 83.1 |
| December | 1019.6 | 18.6 | 16.1 | 14.0 | 8.6 | 63 | 40 | 88.3 |
| Mean/Total | 1012.7 | 25.9 | 23.3 | 21.4 | 19.0 | 78 | 66 | 2847.3 |
| Normal* | 1012.9 | 25.6 | 23.3 | 21.4 | 19.0 | 78 | 68 | 2398.5 |
| Station | Hong Kong Observatory | |||||||
The annual minimum pressure recorded at the Hong Kong Observatory was 985.7 hectopascals at 2206 HKT on 22 September.
The annual maximum air temperature recorded at the Hong Kong Observatory was 34.9 degrees C at 1511 HKT on 12 August.
The annual minimum air temperature recorded at the Hong Kong Observatory was 9.2 degrees C at 0706 HKT on 18 December.
The annual maximum instantaneous rate of rainfall recorded at King's Park was 252 millimetres per hour at 0916 HKT on 5 April.
 Month |
 Number of hours of Reduced Visibility# (hours) |
 Total Bright Sunshine (hours) |
 Mean Daily Global Solar Radiation (MJ/m2) |
 Total Evaporation (mm) |
 Prevailing Wind Direction (degrees) |
 Mean Wind Speed (km/h) |
|
|---|---|---|---|---|---|---|---|
| January | 214 | 363 | 184.0 | 12.62 | 80.6 | 060 | 21.2 |
| February | 95 | 67 | 98.7 | 11.51 | 71.1 | 070 | 22.6 |
| March | 102 | 51 | 127.4 | 11.78 | 89.1 | 050 | 19.5 |
| April | 112 | 98 | 53.6 | 8.98 | 64.6 | 070 | 22.9 |
| May | 54 | 25 | 90.7 | 12.29 | 95.1 | 060 | 19.7 |
| June | 1 | 2 | 146.1 | 15.83 | 110.9 | 230 | 23.4 |
| July | 0 | 0 | 156.9 | 16.18 | 131.0 | 170 | 20.3 |
| August | 38 | 19 | 148.1 | 14.50 | 119.1 | 200 | 22.7 |
| September | 18 | 26 | 186.0 | 15.98 | 126.3 | 090 | 27.4 |
| October | 76 | 111 | 247.3 | 17.11 | 147.4 | 090 | 23.6 |
| November | 53 | 80 | 133.4 | 11.14 | 95.5 | 080 | 30.5 |
| December | 215 | 318 | 197.4 | 12.20 | 86.7 | 030 | 24.9 |
| Mean/Total | 978 | 1160 | 1769.6 | 13.34 | 1217.4 | 070 | 23.2 |
| Normal* | 692.3 | 1393.0§ | 1835.6 | 12.85 | 1227.3 | 080 | 23.3 |
| Station | Hong Kong Observatory |
Hong Kong International Airport |
King's Park | Waglan Island^ | |||
The annual maximum gust peak speed recorded at Waglan Island was 113 kilometres per hour from 190 degrees at 0633 HKT on 26 May.
# Reduced visibility refers to visibility below 8 kilometres when there is no fog, mist, or precipitation.
- The visibility readings at the Hong Kong International Airport are based on hourly observations by professional meteorological observers in 2004 and before, and average readings over the 10-minute period before the clock hour of the visibility meter near the middle of the south runway from 2005 onwards. The change of the data source in 2005 is an improvement of the visibility assessment using instrumented observations following the international trend.
- Before 10 October 2007, the number of hours of reduced visibility at the Hong Kong International Airport in 2005 and thereafter displayed in this web page was based on hourly visibility observations by professional meteorological observers. Since 10 October 2007, the data have been revised using the average visibility readings over the 10-minute period before the clock hour, as recorded by the visibility meter near the middle of the south runway.
^ In case the data are not available from Waglan Island, observations of Cheung Chau or other nearby weather stations will be incorporated in computing the Prevailing Wind Direction and Mean Wind Speed
 Month |
 Number of Hot Day |
 Number of Hot Night |
 Number of Cold Day |
 Number of days with thunderstorms |
|---|---|---|---|---|
| January | - | - | 3 | - |
| February | - | - | 1 | - |
| March | - | - | - | 5 |
| April | - | - | - | 8 |
| May | 1 | 1 | - | 10 |
| June | 5 | 6 | - | 5 |
| July | 5 | 1 | - | 14 |
| August | 5 | 1 | - | 7 |
| September | 1 | 1 | - | 4 |
| October | - | - | - | - |
| November | - | - | - | - |
| December | - | - | 10 | - |
| Total | 17 | 10 | 14 | 53 |
| Normal* | 10.2 | 17.8 | 17.1 | 38.6 |
| Station | Hong Kong Observatory | |||
* 1981-2010 Climatological Normal, unless otherwise specified
§ 1997-2012 Mean value