The Year's Weather - 2012
Globally, despite the cooling influence of a weak-to-moderate La Nina at the beginning of the year, 2012 is still an unusually warm year in many parts of the world. The global average temperature from January to November 2012 is likely to rank among the top ten warmest for the same period. Moreover, notable extreme weather events were observed worldwide in 2012, including major heat waves in the United States and Europe, the cold spell in the Eurasian continent, severe drought in the continental United States, the northern part of Mexico, western Russia, Southeast Europe, northern Brazil and the Yunnan and Sichuan provinces of China, extreme flooding in parts of Africa and Pakistan, and tropical cyclone induced torrential rain in the Philippines, Japan, Korean Peninsula and the northeastern part of contiguous United States. Over the Arctic, the sea ice extent also reached a new record low in September 2012.
In Hong Kong, 2012 started with significantly colder than normal weather in January and February which was mainly due to the stronger northeast monsoon over southern China usually in the presence of La Nina. However, with La Nina fading out in spring, the below-normal temperature was compensated by the exceptionally warm weather in April, May and August in 2012. Overall, the average temperature of 2012 was 23.4 degrees, 0.1 degrees above the 1981-2010 normal[1] figure of 23.3 degrees (which was 0.4 degrees above the 1961-1990 normal figure of 23.0 degrees when we consider an earlier timeframe) and ranking the 12th highest since record began in 1885. For extreme temperatures, there were 21 Very Hot Days[2], 23 Hot Nights[3] and 21 Cold Days[4] in 2012, about 11, 5 and 4 days more than the 1981-2010 normal figures respectively. The maximum temperature recorded at the Hong Kong Observatory in 2012 was 34.5 degrees on 28 August. During the passage of an intense cold surge of the winter monsoon, the minimum temperature of the year of 7.1 degrees was recorded on 31 December. This was also the third coldest New Year's Eve on record.
The year 2012 was drier than usual. With well below normal rainfall in June and August, the annual rainfall of 1924.7 millimetres was about 20 percent below the 1981-2010 normal (which was about 13 percent below the 1961-1990 normal). There were only two red rainstorm warnings issued by the Hong Kong Observatory in 2012, about one half of the average number of red rainstorm warnings in a year since the Rainstorm Warning System commenced operation in 1992. There was no black rainstorm warning issued in the year. The number of days with thunderstorms reported in Hong Kong was 37 days in 2012, close to the 1981-2010 normal.
It was exceptionally gloomy in 2012, particularly in the first two months and the last two months of the year. The annual total duration of bright sunshine of 1551.2 hours was the lowest since record began in 1885.
A total of 27 tropical cyclones occurred over the western North Pacific and the South China Sea in 2012, slightly less than the normal annual figure of around 29. Fifteen of the tropical cyclones reached typhoon intensity[5] or above during the year, close to the normal annual figure. In Hong Kong, five tropical cyclones necessitated the issuance of local tropical cyclone warning signals, close to the long term average of about six in a year. The Hurricane Signal No. 10 was issued during the passage of Vicente in July, while the No. 8 Gale or Storm Signal was issued during the passages of Doksuri and Kai-tak respectively in June and August.
Detailed descriptions of the weather for individual months are available in the Monthly Weather Summary webpage from the following URL: http://www.hko.gov.hk/wxinfo/pastwx/mws.htm
Some significant weather events in Hong Kong in 2012 are highlighted below:
Rather cold January and February
January and February 2012 were significantly colder than usual because of the stronger winter monsoon over South China under the influence of La Nina. The mean temperature of the two months was 15.5 degrees, 1.1 degrees below the normal figure of 16.6 degrees. In the morning on 25 January, the temperature at the Hong Kong Observatory fell to a minimum of 7.4 degrees, the lowest during the Lunar New Year holidays since 1996.
Exceptionally warm in April and May
Under the prevalence of a warm maritime airstream most of the time, the weather of April and May 2012 was exceptionally warm in Hong Kong. The mean temperature recorded at the Hong Kong Observatory for these two months was 25.5 degrees, 1.2 degrees above the normal figure of 24.3 degrees for the same period. The daily mean temperature of 28.5 degrees recorded on 30 April 2012 tied with that on 26 April 1994 as the highest in April since record began in 1884. The daily minimum temperature reached 28.0 degrees on 3 May 2012, the earliest occurrence of 'Hot Night'[3] since record began. The mean temperature of 27.7 degrees during 1 to 15 May tied with that of 1977 as the highest in the first half of May since record began.
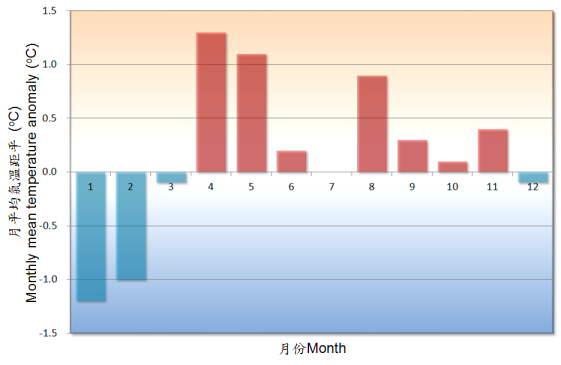
Fig. 1 Monthly mean temperature anomalies in Hong Kong in 2012
The hottest August
August 2012 was one of the hottest Augusts on record in Hong Kong which was mainly attributed to the prevalence of the dry subsiding airstream associated with tropical cyclones Saola, Kai-tak and Tembin. The monthly mean temperature rose to 29.5 degrees which was 0.9 degrees above normal, matching the records set in 1990, 1998 and 2011. It was also the driest August in Hong Kong since 1992. The monthly total rainfall was 149.8 millimetres, only about 35 percent of the normal figure of 432.2 millimetres.
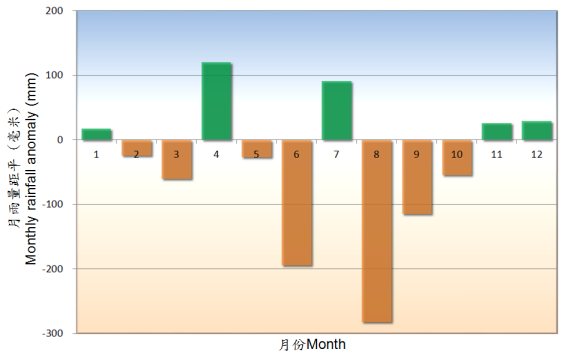
Fig. 2 Monthly total rainfall anomalies in Hong Kong in 2012
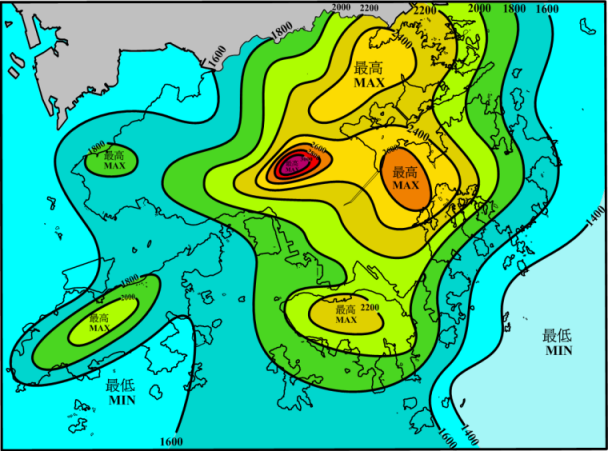
Fig. 3 Annual rainfall distribution in Hong Kong in 2012
The first Hurricane Signal No. 10 since 1999
The Hong Kong Observatory issued the Hurricane Signal No. 10, the highest tropical cyclone warning signal in Hong Kong, on 24 July 2012 during the passage of Severe Typhoon Vicente. This was the first No. 10 Signal since Typhoon York 13 years ago in September 1999. Packed with an estimated maximum sustained winds of 155 km/hr near its centre, Vicente passed about 100 km to the southwest of Hong Kong, and was the farthest tropical cyclone that had necessitated the issuance of the No. 10 Signal in Hong Kong since 1946. Vicente underwent rapid intensification within around 30 hours prior to its closest approach to Hong Kong, strengthening by three categories from a tropical storm to a severe typhoon[5]. Such rapid intensification of tropical cyclones near the territory was rather rare since 1946. At least 138 people were injured during the strike of Vicente. The number of fallen trees amounted to about 8800.
(Please refer to the Report of Severe Typhoon Vicente available at http://www.hko.gov.hk/informtc/vicente/vicente.htm for more details).
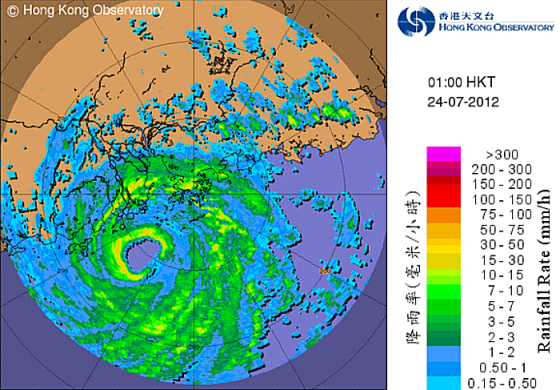
Fig. 4 Radar echoes captured at 1:00 a.m. on 24 July 2012, showing the centre of Severe
Typhoon Vicente about 100 km to the southwest of the Observatory
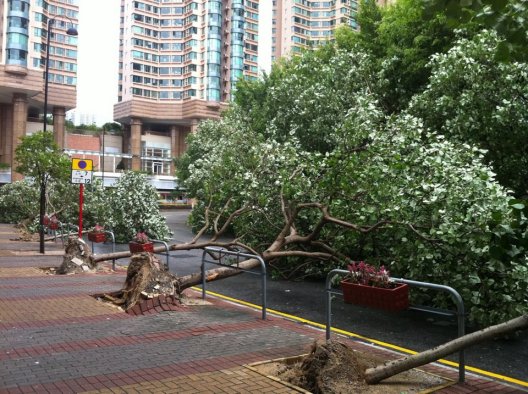
Fig. 5 Trees blown down near Olympian City during the strike of Severe Typhoon Vicente
(Courtesy of Ms. Carly Tse)
Extremely gloomy and humid in November
As a result of the frequent interchange between cool northeast monsoon and warm and humid maritime airstream over the south China coastal areas, November 2012 was marked by unseasonably gloomy and humid weather, particularly in the latter part of the month. The total duration of bright sunshine captured in the month was only 101.4 hours, a record low for November since 1885. The monthly mean relative humidity was 81 percent, tying with that of 1960 as the highest record for November.
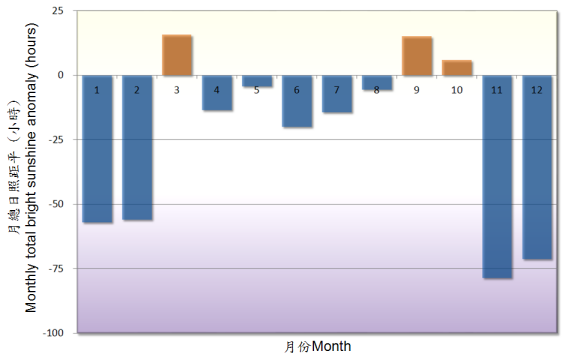
Fig. 6 Monthly total duration of bright sunshine anomalies in Hong Kong in 2012
A gloomy December with a cold New Year's Eve
Affected by rain-bearing cloud bands associated with the northeast monsoon during the first and last part of the month, December 2012 was significantly gloomier than usual. The total duration of bright sunshine in the month was 101.0 hours, 41 percent below the normal figure of 172.2 hours and ranking the fifth lowest on record for December. During the passage of an intense cold surge of the winter monsoon on the last day of December, the temperature dropped to a minimum of 7.1 degrees, making this the third coldest New Year's Eve on record.
Note :
[1] Climatological normals for the reference period of 1961-1990, 1971-2000 and 1981-2010 are available at : http://www.weather.gov.hk/cis/normal_e.htm. Climatological normals of 1981-2010 are referenced in the text unless otherwise stated.
[2] 'Very Hot Day' refers to the condition with the daily maximum temperature equal to or higher than 33.0 degrees.
[3] 'Hot Night' refers to the condition with the daily minimum temperature equal to or higher than 28.0 degrees.
[4] 'Cold Day' refers to the condition with the daily minimum temperature equal to or lower than 12.0 degrees.
[5] Information on the classification of tropical cyclones is available at: http://www.hko.gov.hk/informtc/class.htm
 Month |
 Mean Pressure (hPa) |
Air Temperature |  Mean Dew Point (deg. C) |
 Mean Relative Humidity (%) |
 Mean Amount of Cloud (%) |
 Total Rainfall (mm) |
||
|---|---|---|---|---|---|---|---|---|
 Mean Daily Maximum (deg. C) |
 Mean (deg. C) |
 Mean Daily Minimum (deg. C) |
||||||
| January | 1019.3 | 17.0 | 15.1 | 13.5 | 11.9 | 82 | 79 | 42.1 |
| February | 1016.8 | 17.8 | 15.8 | 14.0 | 13.1 | 85 | 84 | 29.5 |
| March | 1015.6 | 21.8 | 19.0 | 16.9 | 15.8 | 83 | 75 | 22.1 |
| April | 1011.3 | 26.2 | 23.9 | 22.0 | 21.2 | 85 | 80 | 294.9 |
| May | 1007.5 | 29.4 | 27.0 | 25.5 | 24.4 | 86 | 78 | 277.7 |
| June | 1002.6 | 30.5 | 28.1 | 26.4 | 25.0 | 83 | 78 | 261.5 |
| July | 1004.6 | 31.6 | 28.8 | 26.8 | 25.2 | 81 | 70 | 467.8 |
| August | 1003.3 | 32.3 | 29.5 | 27.4 | 24.9 | 77 | 71 | 149.8 |
| September | 1010.3 | 30.9 | 28.0 | 26.0 | 23.0 | 75 | 65 | 213.0 |
| October | 1014.3 | 28.3 | 25.6 | 23.7 | 20.4 | 74 | 59 | 46.4 |
| November | 1015.5 | 24.2 | 22.2 | 20.6 | 18.7 | 81 | 76 | 63.9 |
| December | 1018.3 | 19.7 | 17.8 | 15.9 | 13.8 | 78 | 74 | 56.0 |
| Mean/Total | 1011.6 | 25.8 | 23.4 | 21.6 | 19.8 | 81 | 74 | 1924.7 |
| Normal* | 1012.9 | 25.6 | 23.3 | 21.4 | 19.0 | 78 | 68 | 2398.5 |
| Station | Hong Kong Observatory | |||||||
The minimum pressure recorded at the Hong Kong Observatory was 986.0 hectopascals at 0053 HKT on 24 July.
The maximum air temperature recorded at the Hong Kong Observatory was 34.5 degrees C at 1301 HKT on 28 August.
The minimum air temperature recorded at the Hong Kong Observatory was 7.1 degrees C at 0650 HKT on 31 December.
The maximum instantaneous rate of rainfall recorded at the Hong Kong Observatory was 332 millimetres per hour at 0926 HKT on 5 July.
 Month |
 Number of hours of Reduced Visibility# (hours) |
 Total Bright Sunshine (hours) |
 Mean Daily Global Solar Radiation (MJ/m2) |
 Total Evaporation (mm) |
 Prevailing Wind Direction (degrees) |
 Mean Wind Speed (km/h) |
|
|---|---|---|---|---|---|---|---|
| January | 193 | 223 | 86.0 | 8.16 | 54.8 | 030 | 23.3 |
| February | 93 | 120 | 38.1 | 7.49 | 45.9 | 040 | 25.4 |
| March | 54 | 61 | 106.5 | 11.62 | 79.7 | 050 | 24.0 |
| April | 83 | 55 | 88.1 | 11.45 | 96.9 | 080 | 21.4 |
| May | 14 | 7 | 136.1 | 15.14 | 117.9 | 100 | 24.0 |
| June | 22 | 27 | 126.0 | 14.10 | 113.5 | 100 | 26.0 |
| July | 10 | 7 | 197.6 | 18.14 | 154.7 | 230 | 22.6 |
| August | 144 | 57 | 183.2 | 16.46 | 143.1 | 230 | 17.0 |
| September | 35 | 5 | 187.4 | 16.76 | 140.5 | 110 | 20.0 |
| October | 91 | 117 | 199.8 | 14.97 | 125.8 | 100 | 25.7 |
| November | 63 | 59 | 101.4 | 8.97 | 69.3 | 080 | 26.2 |
| December | 85 | 88 | 101.0 | 8.81 | 68.3 | 070 | 31.3 |
| Mean/Total | 887 | 826 | 1551.2 | 12.67 | 1210.4 | 050 | 23.9 |
| Normal* | 692.3 | 1430.7§ | 1835.6 | 12.85 | 1227.3 | 080 | 23.3 |
| Station | Hong Kong Observatory |
Hong Kong International Airport |
King's Park | Waglan Island^ | |||
The maximum gust peak speed recorded at Waglan Island was 149 kilometres per hour from 110 degrees at 2210 HKT on 23 July.
# Reduced visibility refers to visibility below 8 kilometres when there is no fog, mist, or precipitation.
- The visibility readings at the Hong Kong International Airport are based on hourly observations by professional meteorological observers in 2004 and before, and average readings over the 10-minute period before the clock hour of the visibility meter near the middle of the south runway from 2005 onwards. The change of the data source in 2005 is an improvement of the visibility assessment using instrumented observations following the international trend.
- Before 10 October 2007, the number of hours of reduced visibility at the Hong Kong International Airport in 2005 and thereafter displayed in this web page was based on hourly visibility observations by professional meteorological observers. Since 10 October 2007, the data have been revised using the average visibility readings over the 10-minute period before the clock hour, as recorded by the visibility meter near the middle of the south runway.
^ In case the data are not available from Waglan Island, observations of Cheung Chau or other nearby weather stations will be incorporated in computing the Prevailing Wind Direction and Mean Wind Speed
 Month |
 Number of Very Hot Day |
 Number of Hot Night |
 Number of Cold Day |
 Number of days with thunderstorms |
|---|---|---|---|---|
| January | - | - | 8 | - |
| February | - | - | 7 | - |
| March | - | - | 2 | - |
| April | - | - | - | 9 |
| May | - | 1 | - | 7 |
| June | 2 | 6 | - | 3 |
| July | 7 | 5 | - | 7 |
| August | 10 | 11 | - | 6 |
| September | 2 | - | - | 5 |
| Ocotber | - | - | - | - |
| November | - | - | - | - |
| December | - | - | 4 | - |
| Total | 21 | 23 | 21 | 37 |
| Normal* | 10.2 | 17.8 | 17.1 | 38.6 |
| Station | Hong Kong Observatory | |||
* 1981-2010 Climatological Normal, unless otherwise specified
§ 1997-2011 Mean value