The Year's Weather - 2011
Globally, despite the cooling influence of the La Nina conditions in early and late 2011, the year 2011 is still likely to rank as the tenth warmest year on record. The current La Nina condition, which developed by the end of 2011, is expected to persist into early 2012. For extreme weather events, it was eventful worldwide in 2011. Notably, there were drought and high temperatures in southwestern China and southern United States, dramatic change from drought to flood conditions in east Africa and central China, severe flooding in Pakistan, eastern Australia, Thailand and southeastern Brazil, deadly tornadoes in United States, and tropical cyclone induced torrential rain in Japan and the Philippines.
Locally in 2011, Hong Kong experienced appreciably colder weather from January to March and in December. This is attributed to the stronger northeast monsoon over southern China usually under the effect of La Nina. However, the below-normal temperatures in these four months were almost offset by the noticeably warmer August and November. The average temperature of 2011 ended up with a near normal value of 23.0 degrees.
The year 2011 was also an exceptionally dry year. With well below normal rainfall in the first nine months, the annual rainfall of 1487.2 millimetres was about 38 per cent below normal, the lowest since 1963.
During 2011, there were only two red rainstorm warnings issued by the Hong Kong Observatory, about one half of the average number of red rainstorm warnings in a year since operation of the Rainstorm Warning System in 1992. There was no black rainstorm warning issued in the year.
A total of 22 tropical cyclones formed over the western North Pacific and the South China Sea in 2011, less than the normal figure of around 30. Four of them reached super typhoon* intensity during the year. In Hong Kong, five tropical cyclones necessitated the issuance of local tropical cyclone warning signals, slightly less than the long term average of about six in a year. Typhoon Nesat, which affected Hong Kong in September, necessitated the issuance of the No.8 Gale or Storm Signal.
Detailed descriptions of the weather for individual months are available in the Monthly Weather Summary webpage from the following URL: http://www.hko.gov.hk/wxinfo/pastwx/mws.htm
Some significant weather events in Hong Kong in 2011 are highlighted below:
An exceptionally dry year
The annual rainfall in 2011 was 1487.2 millimetres which was the lowest since 1963. The rainfall deficit in 2011 was mainly attributed to the substantially less than normal rainfall in the first nine months. From January to April, under the influence of the La Nina conditions, a stronger and drier northeast monsoon prevailed over southern China and brought less rain to Hong Kong. The lack of rainfall from May to September was due to a number of factors including weaker southerly flows over the South China coast in May and the stronger anticyclone prevailing over southern China in August and September.
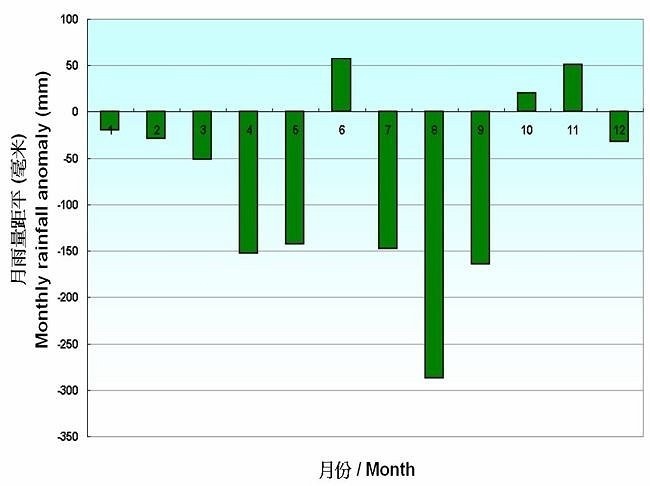
Monthly total rainfall anomalies in 2011
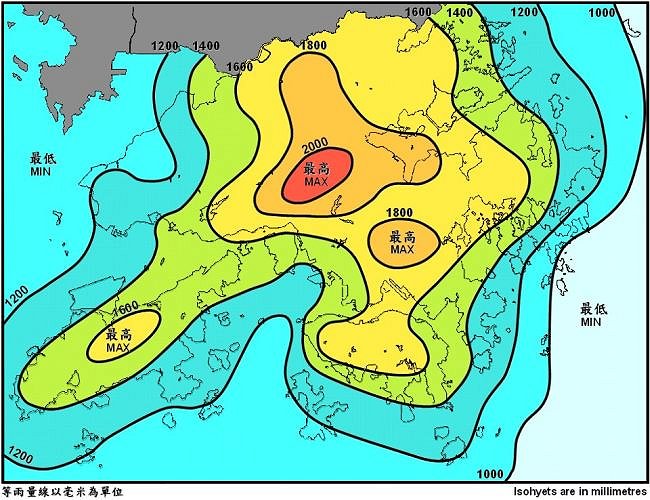
Annual rainfall distribution in 2011
Cold and dry from January to March
Under the influence of the La Nina conditions, Hong Kong experienced stronger than normal northeast monsoon and appreciably colder and drier weather for the first three months of 2011. The average temperature from January to March was 1.1 degrees lower than normal. In particular, the mean temperature for January was 13.7 degrees, the lowest since 1977. There were 14 cold days# in January, double the normal figure of about 7 days in the month. Besides the below normal rainfall, the average relative humidity of these three months was also lower than the normal figure by 6%. The monthly mean relative humidity of 71% for March 2011 was even 11% below normal, the lowest for March on record.
Red rainstorms on 22 May
Although 2011 was a dry year, there were two episodes of heavy rain on 22 May which necessitated the issuance of the red rainstorm warning. On the morning of 22 May, under the influence of an active trough of low pressure over the northern part of the South China Sea, local weather deteriorated with heavy rain and squally thunderstorms. The red rainstorm warning was in force from 11:10 a.m. to 2:45 p.m. Meanwhile, another trough of low pressure over inland Guangdong edged southwards to cross the coast that evening, bringing another episode of heavy downpour to the territory. The red rainstorm warning was issued again between 9:55 p.m. and 11:25 p.m. on the same day. Totally, more than 100 millimetres of rainfall were recorded over most parts of Hong Kong with more than 200 millimetres over parts of the New Territories on that day. During the rainstorm episodes, 25 cases of flooding and 2 cases of landslip were reported.
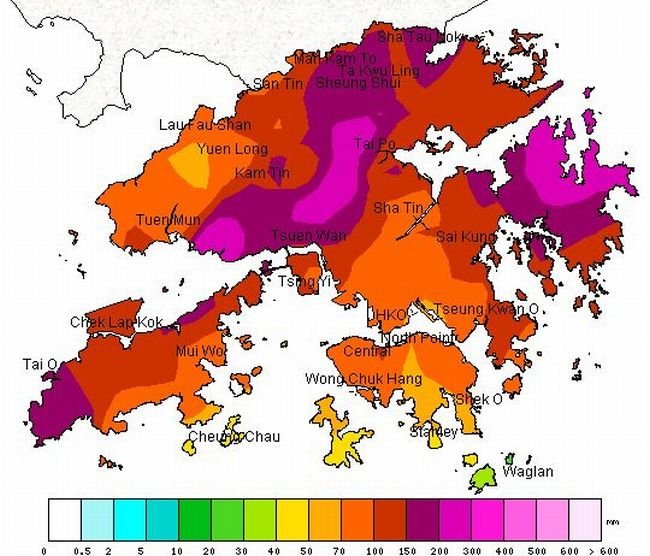
Rainfall distribution on 22 May 2011
Unusually warm in August and November
With the stronger than normal anticyclone covering southern China, it was unusually warm in August. The monthly mean temperature in August soared to 29.5 degrees, equaling the record set in 1990 and 1998 as one of the hottest August since record began in 1884. There were 10 very hot days& in August, more than three times of the normal figure of about 3 days in the month. With relatively weak northeast monsoon, it was also unusually warm in November. The monthly mean temperature in November was 23.0 degrees, 1.6 degrees above normal, making the month the fifth warmest November on record.
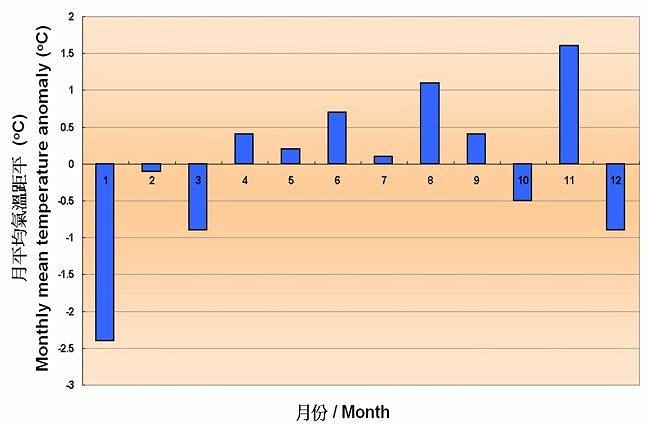
Monthly mean temperature anomalies in 2011
Tropical cyclones affecting Hong Kong
The typhoon season in Hong Kong in 2011 started on 10 June when Tropical Storm Sarika came within 800 km of Hong Kong and the Standby Signal No. 1 was issued. The Strong Wind Signal No. 3 was issued during the approach of Tropical Storm Haima, Severe Tropical Storm Nock-ten and Severe Typhoon Nalgae. The No. 8 SE Gale or Storm Signal, the first No.8 Signal since September 2009, was issued on 29 September as Typhoon Nesat passed about 350 km to the south-southwest of Hong Kong. During the passage of Nesat, a crane barge drifted towards the seas off Chai Wan after its anchor cable was snapped. The barge first hit a pier at an oil storage depot in Chai Wan and then slammed into a sea wall at the Heng Fa Chuen promenade. Detailed report of Nesat is available from the URL below :
http://www.hko.gov.hk/informtc/nesat/report.htm

A barge shoving the sea wall over the sea off Heng Fa Chuen
during the passage of Typhoon Nesat on 29 September 2011
(Photo courtesy of Xinhua News Agency)
* Super typhoon refers to a tropical cyclone with maximum 10-minute wind speed of 185 km/h or above near the centre.
# Cold day refers to a day with daily minimum temperature at 12.0 degrees or below.
& Hot day refers to a day with daily maximum temperature at 33.0 degrees or above.
 Month |
 Mean Pressure (hPa) |
Air Temperature |  Mean Dew Point (deg. C) |
 Mean Relative Humidity (%) |
 Mean Amount of Cloud (%) |
 Total Rainfall (mm) |
||
|---|---|---|---|---|---|---|---|---|
 Mean Daily Maximum (deg. C) |
 Mean (deg. C) |
 Mean Daily Minimum (deg. C) |
||||||
| January | 1021.5 | 16.3 | 13.7 | 11.6 | 7.5 | 67 | 63 | 5.4 |
| February | 1017.1 | 19.1 | 16.2 | 14.2 | 12.0 | 77 | 65 | 23.7 |
| March | 1018.7 | 21.1 | 18.0 | 15.7 | 12.4 | 71 | 79 | 20.5 |
| April | 1014.0 | 26.9 | 22.9 | 20.6 | 18.2 | 76 | 59 | 36.0 |
| May | 1009.2 | 29.0 | 26.0 | 24.1 | 22.4 | 81 | 73 | 186.7 |
| June | 1005.3 | 31.3 | 28.6 | 26.7 | 25.0 | 82 | 74 | 446.1 |
| July | 1004.4 | 31.4 | 28.8 | 27.0 | 25.1 | 81 | 64 | 226.8 |
| August | 1006.1 | 32.4 | 29.5 | 27.4 | 24.8 | 77 | 56 | 157.6 |
| September | 1007.6 | 30.6 | 28.0 | 26.0 | 23.9 | 79 | 70 | 123.1 |
| October | 1013.9 | 27.3 | 24.8 | 23.2 | 20.6 | 78 | 62 | 172.4 |
| November | 1015.4 | 25.3 | 23.0 | 21.5 | 18.7 | 77 | 70 | 86.1 |
| December | 1020.9 | 19.4 | 16.9 | 14.6 | 9.9 | 65 | 50 | 2.8 |
| Mean/Total | 1012.8 | 25.8 | 23.0 | 21.1 | 18.4 | 76 | 65 | 1487.2 |
| Normal* | 1013.0 | 25.6 | 23.1 | 21.1 | 18.8 | 78 | 67 | 2382.7 |
| Station | Hong Kong Observatory | |||||||
 Month |
 Number of hours of Reduced Visibility# (hours) |
 Total Bright Sunshine (hours) |
 Mean Daily Global Solar Radiation (MJ/m2) |
 Total Evaporation (mm) |
 Prevailing Wind Direction (degrees) |
 Mean Wind Speed (km/h) |
|---|---|---|---|---|---|---|
| January | 376 | 158.6 | 11.38 | 84.1 | 020 | 27.0 |
| February | 201 | 127.7 | 11.47 | 68.4 | 040 | 22.5 |
| March | 183 | 108.6 | 11.96 | 95.3 | 030 | 26.2 |
| April | 76 | 191.6 | 17.16 | 115.5 | 070 | 18.4 |
| May | 114 | 150.5 | 15.94 | 121.8 | 050 | 16.9 |
| June | 11 | 149.5 | 15.43 | 119.5 | 200 | 21.6 |
| July | 25 | 202.3 | 18.47 | 159.7 | 220 | 19.3 |
| August | 66 | 242.0 | 19.81 | 168.9 | 220 | 13.4 |
| September | 29 | 158.5 | 15.52 | 132.9 | 110 | 26.4 |
| October | 66 | 161.1 | 13.17 | 112.3 | 080 | 29.3 |
| November | 85 | 134.2 | 11.45 | 96.3 | 070 | 27.3 |
| December | 206 | 193.9 | 12.61 | 101.6 | 020 | 28.1 |
| Mean/Total | 1438 | 1978.5 | 14.53 | 1376.3 | 060 | 23.0 |
| Normal* | 1430.2§ | 1842.9 | 13.23 | 1343.4 | 070 | 23.9 |
| Station | Hong Kong International Aiport |
King's Park | Waglan Island^ | |||
The minimum pressure recorded at the Hong Kong Observatory was 995.2 hectopascals at 1631 HKT on 22 June. The maximum air temperature recorded at the Hong Kong Observatory was 35.0 degrees Celsius at 1347 HKT on 7 August. The minimum air temperature recorded at the Hong Kong Observatory was 7.2 degrees Celsius at 0249 HKT on 12 January. The maximum gust peak speed recorded at Waglan Island was 110 kilometres per hour from 090 degrees at 0114 HKT on 29 September. The maximum instantaneous rate of rainfall recorded at the Hong Kong Observatory was 238 millimetres per hour at 0119 HKT on 16 July.
# Reduced visibility refers to visibility below 8 kilometres when there is no fog, mist, or precipitation. - The visibility readings at the Hong Kong International Airport are based on hourly observations by professional meteorological observers in 2004 and before, and average readings over the 10-minute period before the clock hour of the visibility meter near the middle of the south runway from 2005 onwards. The change of the data source in 2005 is an improvement of the visibility assessment using instrumented observations following the international trend. - Before 10 October 2007, the number of hours of reduced visibility at the Hong Kong International Airport in 2005 and thereafter displayed in this web page was based on hourly visibility observations by professional meteorological observers. Since 10 October 2007, the data have been revised using the average visibility readings over the 10-minute period before the clock hour, as recorded by the visibility meter near the middle of the south runway. * 1971-2000 Climatological Normal, unless otherwise specified § 1997-2010 Mean value ^ In case the data are not available from Waglan Island, observations of Cheung Chau or other nearby weather stations will be incorporated in computing the Prevailing Wind Direction and Mean Wind Speed |