The Year's Weather - 2010
According to the World Meteorological Organization, year 2010 is almost certain to rank among the top 3 warmest years globally since the beginning of instrumental climate records in 1850. In Hong Kong, 2010 was characterized by irregular variations in temperature and rainfall, despite the annual figures were close to normal.
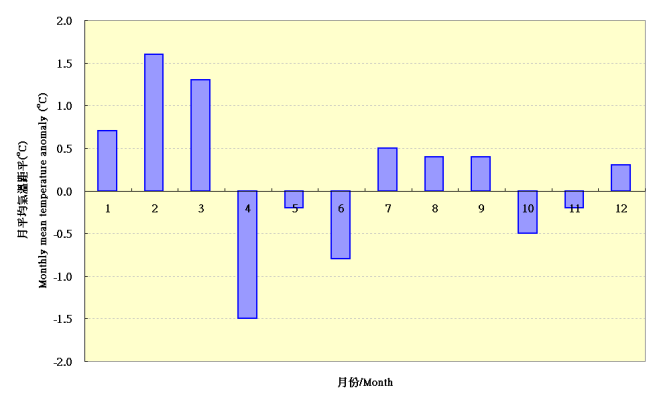
Year 2010 started off with three notably warm months with monthly mean temperatures 0.7 to 1.6 degree above normal. This anomaly was mostly offset by the well below normal monthly mean temperatures in April and June, the former due to frequent passage of late season cold fronts and the latter due to gloomy weather. With insignificant anomalies of monthly mean temperatures in the second half of the year, the annual mean temperature in 2010 ended up to 23.2 degrees, close to the normal figure of 23.1 degrees. During the year, there were 13 very hot days (daily maximum temperature at 33.0 degrees or above) and 21 cold days (daily minimum temperature at 12.0 degrees or below), 3 days and 2 days more than normal respectively.
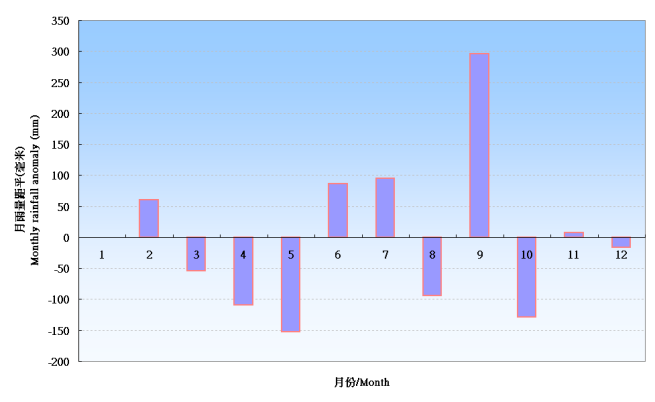
Despite a record breaking daily rainfall of 94.1 millimetres for February, the first half of year 2010 was relatively dry with the total rainfall about 16% below normal. However, the two heavy rain episodes which necessitated the issuance of the Black Rainstorm Warning in July and the torrential rainfall due to the passage of two tropical cyclones, namely Lionrock and Fanapi in September, added up the annual rainfall to 2 371.7 millimetres which was close to the normal figure of 2 382.7 millimetres.
A total of 18 tropical cyclones occurred over the western North Pacific and the South China Sea in 2010, considerably less than the normal figure of around 30 tropical cyclones in a year. Super Typhoon Megi was the most intense tropical cyclone of the year, and was the only tropical cyclone that had reached super typhoon intensity (maximum 10-minute wind speed of 185 km/h or above near the centre) in the region. In Hong Kong, five tropical cyclones necessitated the issuance of local tropical cyclone warning signals, slightly less than the annual average of six to seven. The typhoon season started later than normal on 15 July when Typhoon Conson came within 800 km of Hong Kong and the Standby Signal No. 1 was issued. Typhoon Chanthu, Severe Typhoon Fanapi and Super Typhoon Megi necessitated the issuance of the Strong Wind Signal No. 3 during their passages from July to October.
As for individual months, January was 0.7 degree milder than usual. There were only 4 cold days (daily minimum temperature at 12.0 degrees or below) in the month, the least for January since 2001.
The cold snap during the Chinese New Year period was more than counter-balanced by a persistently warm and humid maritime airstream towards the end of the month, making February wetter and 1.6 degree milder than usual.
It was mild and dry with plenty of sunshine in March. The northeast monsoon carried sand and dust originated from sandstorms over northern China down the Taiwan Strait to reach the coast of Guangdong on 21 March, resulting in rather low visibility in Hong Kong on 21 and 22 March.
Due to frequent passage of cold fronts, April was 1.5 degree cooler than usual.
The rainfall over the territory was highly uneven in May. The total rainfall recorded at the Hong Kong Observatory Headquarters in the month was only 176.6 millimetres, about 54% of the normal figure of 329.5 millimetres, whereas over 300 millimetres of rainfall were recorded at the eastern part of the New Territories and western Lantau.
June was gloomier than usual. The total bright sunshine duration was only 58 percent of the normal figure. As a result, June was 0.8 degree cooler than usual.
July was hotter than usual with 8 very hot days (daily maximum temperature of 33.0 degrees or above) in the month. The two heavy rain episodes which necessitated the issuance of the Black Rainstorm Warning on 22 and 28 July respectively made the month wetter than usual. Waterspouts associated with unstable weather were reported on 22 and 27 July.
Dominated by a relatively strong Pacific ridge of high pressure, August was sunnier and drier than usual.
September was the wettest month of the year with monthly rainfall of 583.1 millimetres, more than double the normal figure of 287.5 millimetres. Under severe thundery activities, 13 102 strokes of cloud-to-ground lightning were registered in Hong Kong during the hour just after midnight on 9 September, the highest hourly reading since record began in 2005.
Due to the dominance of an intense northeast monsoon over southern China in the last six days of the month, October was cooler than usual.
With prevalence of dry northeast monsoon, there was ample sunshine in November.
Despite several cold episodes in the month, December was slightly milder than normal with abundant sunshine.
Figure 1 and 2 show respectively the monthly mean temperature anomalies and total rainfall anomalies in 2010.

Figure 2. Monthly total rainfall anomalies for year 2010

 Month |
 Mean Pressure (hPa) |
Air Temperature |  Mean Dew Point (deg. C) |
 Mean Relative Humidity (%) |
 Mean Amount of Cloud (%) |
 Total Rainfall (mm) |
||
|---|---|---|---|---|---|---|---|---|
 Mean Daily Maximum (deg. C) |
 Mean (deg. C) |
 Mean Daily Minimum (deg. C) |
||||||
| January | 1020.5 | 19.0 | 16.8 | 15.2 | 13.3 | 80 | 73 | 24.6 |
| February | 1016.6 | 19.7 | 17.9 | 16.3 | 15.8 | 88 | 88 | 113.1 |
| March | 1016.9 | 23.1 | 20.2 | 18.1 | 16.4 | 80 | 73 | 17.5 |
| April | 1014.7 | 23.6 | 21.0 | 19.0 | 18.6 | 87 | 84 | 78.9 |
| May | 1008.8 | 28.1 | 25.6 | 23.7 | 22.9 | 86 | 77 | 176.6 |
| June | 1007.8 | 29.2 | 27.1 | 25.4 | 24.4 | 85 | 81 | 474.9 |
| July | 1008.2 | 32.1 | 29.2 | 26.9 | 25.5 | 81 | 69 | 469.4 |
| August | 1008.1 | 31.9 | 28.8 | 26.6 | 25.2 | 81 | 67 | 350.3 |
| September | 1008.7 | 30.5 | 28.0 | 25.9 | 24.6 | 83 | 70 | 583.1 |
| October | 1012.5 | 27.2 | 24.8 | 22.9 | 19.2 | 72 | 67 | 22.7 |
| November | 1017.1 | 23.9 | 21.2 | 19.2 | 16.1 | 74 | 51 | 42.2 |
| December | 1016.3 | 20.8 | 18.1 | 15.6 | 11.1 | 66 | 45 | 18.4 |
| mean or total | 1013.0 | 25.8 | 23.2 | 21.2 | 19.4 | 80 | 70 | 2371.7 |
| Normal* | 1013.0 | 25.6 | 23.1 | 21.1 | 18.8 | 78 | 67 | 2382.7 |
| Station | Hong Kong Observatory | |||||||
 Month |
 Number of hours of Reduced Visibility# (hours) |
 Total Bright Sunshine (hours) |
 Mean Daily Global Solar Radiation (MJ/m2) |
 Total Evaporation (mm) |
 Prevailing Wind Direction (degrees) |
 Mean Wind Speed (km/h) |
|---|---|---|---|---|---|---|
| January | 239 | 108.7 | 9.25 | 58.2 | 040 | 27.1 |
| February | 93 | 31.8 | 6.32 | 38.5 | 030 | 22.7 |
| March | 154 | 110.1 | 11.10 | 75.7 | 030 | 22.2 |
| April | 108 | 49.2 | 9.53 | 63.1 | 030 | 23.0 |
| May | 28 | 112.1 | 14.10 | 109.0 | 080 | 19.0 |
| June | 21 | 92.5 | 12.94 | 100.3 | 210 | 21.0 |
| July | 0 | 247.8 | 20.99 | 175.0 | 210 | 20.4 |
| August | 21 | 213.4 | 18.69 | 154.9 | 080 | 15.5 |
| September | 41 | 179.9 | 15.54 | 126.9 | 060 | 18.6 |
| October | 18 | 165.5 | 13.49 | 124.7 | 020 | 31.5 |
| November | 216 | 212.5 | 13.70 | 94.6 | 070 | 24.0 |
| December | 172 | 185.8 | 12.03 | 95.3 | 020 | 26.3 |
| mean or total | 1111 | 1709.3 | 13.14 | 1216.2 | 030 | 22.6 |
| Normal* | 1454.8 § | 1842.9 | 13.23 | 1343.4 | 070 | 23.9 |
| Station | Hong Kong International Aiport |
King's Park | Waglan Island^ | |||
The minimum pressure recorded at the Hong Kong Observatory was 997.2 hectopascals at 1502 HKT on 20 September. The maximum air temperature recorded at the Hong Kong Observatory was 34.1 degrees Celsius at 1246 HKT on 1 September. The minimum air temperature recorded at the Hong Kong Observatory was 5.8 degrees Celsius at 0559 HKT on 17 December. The maximum gust peak speed recorded at Waglan Island was 122 kilometres per hour from 220 degrees at 0358 HKT on 21 September. The maximum instantaneous rate of rainfall recorded at the Hong Kong Observatory was 320 millimetres per hour at 0238 HKT on 21 September.
# Reduced visibility refers to visibility below 8 kilometres when there is no fog, mist, or precipitation. - The visibility readings at the Hong Kong International Airport are based on hourly observations by professional meteorological observers in 2004 and before, and average readings over the 10-minute period before the clock hour of the visibility meter near the middle of the south runway from 2005 onwards. The change of the data source in 2005 is an improvement of the visibility assessment using instrumented observations following the international trend. - Before 10 October 2007, the number of hours of reduced visibility at the Hong Kong International Airport in 2005 and thereafter displayed in this web page was based on hourly visibility observations by professional meteorological observers. Since 10 October 2007, the data have been revised using the average visibility readings over the 10-minute period before the clock hour, as recorded by the visibility meter near the middle of the south runway. * 1971-2000 Climatological Normal, unless otherwise specified § 1997-2009 Mean value ^ In case the data are not available from Waglan Island, observations of Cheung Chau or other nearby weather stations will be incorporated in computing the Prevailing Wind Direction and Mean Wind Speed |