The Year's Weather - 2007
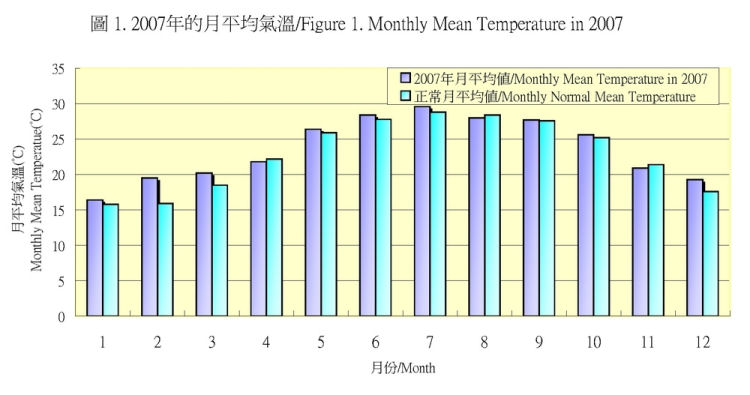
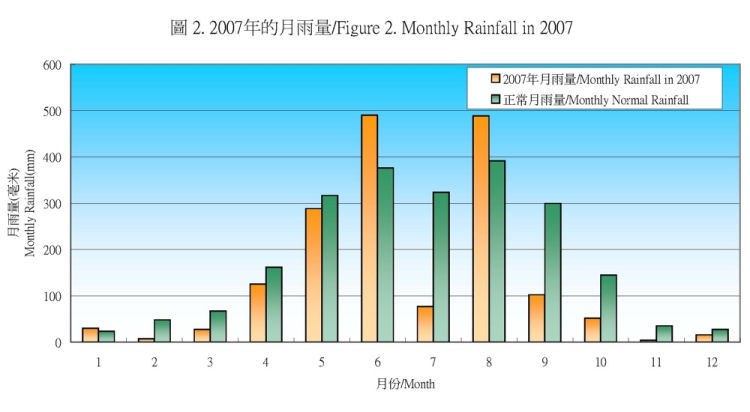
In the northern hemisphere, the year 2007 was the second warmest year on record. In Hong Kong, 2007 was the fifth warmest year since record began in 1884. The annual mean temperature of 23.7 degrees was 0.7 degree higher than normal. With a weaker northeast monsoon, the monthly mean temperature of February 2007 of 19.5 degrees was the highest on record for February. The year sees another new record of hot weather as the Very Hot Weather Warning was issued for 13 days in a row during a hot spell in late July and early August. The year 2007 was also drier than usual. The annual rainfall of 1706.9 millimetres was about 23 per cent below normal.
In 2007, a total of 25 tropical cyclones formed over the western North Pacific and the South China Sea, which was below normal. Only two tropical cyclones, namely Severe Tropical Storm Pabuk and Tropical Storm Francisco, affected Hong Kong, much less than the normal number of 6 or 7. Among them, Pabuk necessitated the issuance of the first Number 8 Gale or Strom Signal since the passage of Tropical Storm Kompasu in 2004.
The less-than-normal rainfall and fewer number of tropical cyclones affecting Hong Kong were mainly due to the stronger-than-normal sub-tropical ridge of high pressure over the western North Pacific and the South China Sea in July, September and October, thus suppressing the convection over the areas.
The first quarter (January to March) in 2007 was much warmer than normal. The mean temperature of 18.7 degrees was the fifth highest for the same period in record.
It became cooler than usual in April. The mean temperature of 21.8 degrees was 0.4 degree below normal.
May 2007 was warmer and sunnier than usual. The total bright sunshine duration of 183.4 hours was about 19 percent above normal.
Under the influence of active troughs of low pressure and southerly airstream, June was wetter than usual. The monthly rainfall amount of 490.1 millimetres was about 30 percent above normal. Severe gusts with speed reaching 129 kilometres per hour were recorded at the Hong Kong International Airport on the morning of 8 June when squally thunderstorms affected the territory. A helicopter of the Government Flying Service parked on the apron was toppled in the gusty winds associated with the thunderstorms.
July was unseasonably dry and warm. The monthly rainfall of 76.9 millimetres, less than one fourth of the normal figure of 323.5 millimetres, was the lowest on record for July. The monthly mean temperature rose to 29.6 degrees, the second highest for July.
August was cloudier and wetter than usual with only 134.3 hours of bright sunshine, the second lowest for August. The No. 8 Gale or Storm Signal was issued on the approach of Severe Tropical Storm Pabuk.
September and October were drier than normal.
November was cooler than usual. The mean temperature of 20.9 degrees was 0.5 degree below normal.
December was warm and hazy. The monthly mean temperature mounted to 19.3 degrees, the fourth highest for December.
Figures 1 and 2 showed respectively the comparison of the monthly mean temperature and monthly rainfall in 2007 with the climatological normal values.


 Month |
 Mean Pressure (hPa) |
Air Temperature |  Mean Dew Point Temperature (deg. C) |
 Mean Relative Humidity (%) |
 Mean Amount of Cloud (%) |
 Total Rainfall (mm) |
||
|---|---|---|---|---|---|---|---|---|
 Mean Daily Maximum (deg. C) |
 Mean (deg. C) |
 Mean Daily Minimum (deg. C) |
||||||
| January | 1022.2 | 18.8 | 16.4 | 14.3 | 10.9 | 72 | 59 | 29.6 |
| February | 1017.6 | 21.9 | 19.5 | 17.8 | 15.5 | 79 | 67 | 6.9 |
| March | 1015.3 | 22.7 | 20.2 | 18.4 | 17.5 | 84 | 84 | 27.6 |
| April | 1014.6 | 24.5 | 21.8 | 19.6 | 17.9 | 80 | 76 | 125.5 |
| May | 1009.7 | 29.7 | 26.4 | 24.3 | 22.4 | 80 | 73 | 288.3 |
| June | 1006.3 | 31.2 | 28.4 | 26.3 | 25.2 | 83 | 78 | 490.1 |
| July | 1006.8 | 32.9 | 29.6 | 27.5 | 25.0 | 77 | 59 | 76.9 |
| August | 1004.0 | 30.7 | 28.0 | 26.1 | 24.9 | 84 | 74 | 488.4 |
| September | 1007.5 | 30.5 | 27.7 | 25.9 | 22.6 | 75 | 69 | 102.3 |
| October | 1013.9 | 28.4 | 25.6 | 23.8 | 20.0 | 72 | 65 | 51.7 |
| November | 1017.4 | 23.8 | 20.9 | 18.7 | 13.5 | 64 | 54 | 3.9 |
| December | 1018.5 | 21.7 | 19.3 | 17.6 | 14.0 | 72 | 57 | 15.7 |
| mean or total | 1012.8 | 26.4 | 23.7 | 21.7 | 19.1 | 77 | 68 | 1706.9 |
| Normal* | 1012.9 | 25.7 | 23.0 | 20.9 | 18.6 | 77 | 65 | 2214.3 |
| Station | Hong Kong Observatory | |||||||
 mmonth |
 Number of hours of Reduced Visibility# (hours) |
 Total Bright Sunshine (hours) |
 Mean Daily Global Solar Radiation & (MJ/m2) |
 Total Evaporation (mm) |
 Prevailing Wind Direction (degrees) |
 mmean Wind Speed (km/h) |
|---|---|---|---|---|---|---|
| January | 427 | 157.9 | 10.98 | 73.6 | 010 | 23.9 |
| February | 194 | 129.6 | 11.51 | 64.1 | 090 | 21.7 |
| March | 102 | 76.1 | 9.69 | 62.5 | 080 | 22.7 |
| April | 161 | 113.1 | 12.27 | 87.5 | 080 | 20.5 |
| May | 158 | 183.4 | 16.60 | 120.4 | 080 | 16.1 |
| June | 16 | 157.1 | 16.25 | 126.8 | 230 | 19.1 |
| July | 0 | 263.2 | 21.78 | 172.3 | 240 | 18.8 |
| August | 81 | 134.3 | 13.51 | 107.9 | 240 | 21.0 |
| September | 238 | 175.4 | 15.56 | 129.4 | 080 | 21.4 |
| October | 299 | 178.8 | 14.31 | 118.1 | 070 | 29.1 |
| November | 171 | 227.0 | 14.50 | 115.0 | 350 | 28.7 |
| December | 420 | 182.8 | 11.85 | 85.8 | 060 | 22.6 |
| mean or total | 2267 | 1978.7 | 14.07 | 1263.4 | 070 | 22.1 |
| Normal* | 1321.0 § | 1948.1 | 14.46 | 1528.8 | 080 | 22.6 |
| Station | Hong Kong International Aiport |
King's Park | Waglan Island^ | |||
The minimum pressure recorded at the Hong Kong Observatory was 990.8 hectopascals at 0443 HKT on 11 August. The maximum air temperature recorded at the Hong Kong Observatory was 35.3 degrees Celsius at 1430 HKT on 3 August. The minimum air temperature recorded at the Hong Kong Observatory was 10.6 degrees Celsius at 0718 HKT on 7 March. The maximum gust peak speed recorded at Waglan Island was 117 kilometres per hour from 270 degrees at 1823 HKT on 18 May. The maximum instantaneous rate of rainfall recorded at the Hong Kong Observatory was 311 millimetres per hour at 0318 HKT on 10 June.
# Reduced visibility refers to visibility below 8 kilometres when there is no fog, mist, or precipitation. - The visibility readings at the Hong Kong International Airport are based on hourly observations by professional meteorological observers in 2004 and before, and average readings over the 10-minute period before the clock hour of the visibility meter near the middle of the south runway from 2005 onwards. The change of the data source in 2005 is an improvement of the visibility assessment using instrumented observations following the international trend. - Before 10 October 2007, the number of hours of reduced visibility at the Hong Kong International Airport in 2005 and thereafter displayed in this web page was based on hourly visibility observations by professional meteorological observers. Since 10 October 2007, the data have been revised using the average visibility readings over the 10-minute period before the clock hour, as recorded by the visibility meter near the middle of the south runway. & The calibration factors of the pyranometer at King's Park in 2006 and 2007 have been re-computed based on the results of a regional instrument comparison in Asia in 2007. The readings of total global solar radiation at King's Park in 2006 and 2007 displayed in this web page before 13 June 2008 have been revised on 13 June 2008 using the new calibration factors. * 1961-1990 Climatological Normal, unless otherwise specified § 1997-2006 Mean value ^ In case the data are not available from Waglan Island, observations of Cheung Chau or other nearby weather stations will be incorporated in computing the Prevailing Wind Direction and Mean Wind Speed |