The Weather of January 2021
January 2021 was characterized by colder weather during the first half of the month and relatively milder weather in the latter part. Overall, the month was colder than usual with a mean temperature of 16.2 degrees, 0.3 degrees below the normal figure of 16.5 degrees (or 0.1 degrees below the 1981-2010 normal). With dry winter monsoon dominating over southern China for most of the time in the month, January 2021 was also much sunnier and drier than usual. The monthly total sunshine duration amounted to 217.3 hours, 49 percent above the normal of 145.8 hours (or 52 percent above the 1981-2010 normal). Only traces of rainfall was recorded in the month, making it one of the eight Januaries with traces of rainfall since records began in 1884.
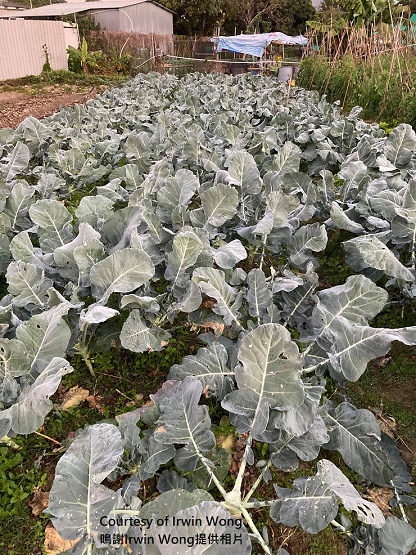
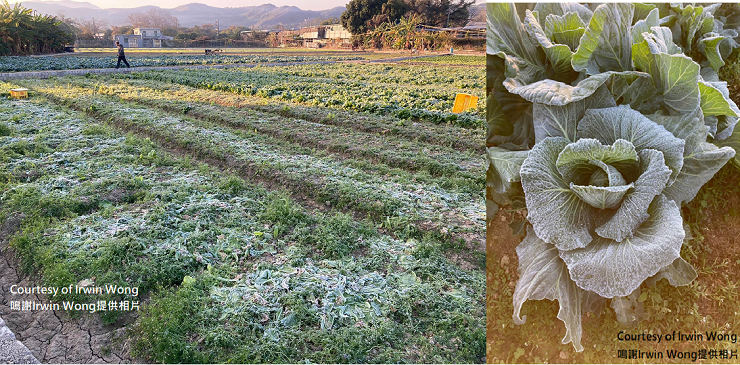
The intense cold surge that affected the south China coastal areas in late December 2020 continued its dominance and brought cold and very dry weather to Hong Kong on the first two days of January 2021. Frost was reported in places over the northern part of the New Territories on 2 January. With the moderation of the winter monsoon, local temperatures rose gradually with sunny periods in the next four days.
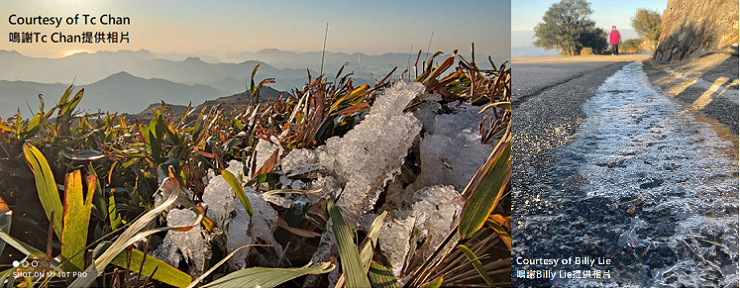
With the strengthening of the winter monsoon, the weather of Hong Kong became appreciably colder on the night of 7 January and the temperature at the Observatory further dropped to a minimum of 7.7 degrees on the morning of 8 January, the lowest of the month. The temperature at Tai Mo Shan even fell to -2.5 degrees on that morning. It was also mainly cloudy and very dry during the day on that day. Under the influence of the winter monsoon and its replenishment, cold and very dry weather persisted on 9 – 14 January. While it was mainly cloudy on 9 – 11 January, the weather became generally fine on 12 January and remained so in the following six days. During the cold episode, icing was reported on high ground of Tai Mo Shan on 8 – 9 and 12 – 13 January. With significant radiation cooling under clear sky, the minimum temperature recorded at Ta Kwu Ling was -0.9 degrees on 13 January, the lowest since records began at that station. Besides, there were frost reports in parts of the New Territories on that morning.
Affected by the cloud bands over the northern part of the South China Sea, the weather became cloudier on the afternoon of 19 January and the next two days. With the cloud bands thinning out, the weather in Hong Kong turned fine and rather warm during the day on 22 - 23 January. With plenty of sunshine, the temperature at the Observatory rose to a maximum of 24.5 degrees on the afternoon of 22 January, the highest of the month. Under light wind conditions, visibility was relatively low in some areas on 21 – 23 January.
Following the arrival of a surge of northeast monsoon, local weather became cloudier and cooler on 24 January. Under the influence of the dry northeast monsoon, it was generally fine and mild during the day on 25 – 28 January. With the strengthening of the monsoon, the weather of Hong Kong became cooler and remained fine on the last three days of the month.
There was no tropical cyclone over the South China Sea and the western North Pacific in January 2021.
Details of issuance and cancellation of various warnings/signals in the month are summarized in Tables 1.1 to 1.4. Monthly meteorological figures and departures from normal for January are tabulated in Table 2.
Warnings and Signals issued in January 2021
| Beginning Time | Ending Time | ||
|---|---|---|---|
| Day/Month | HKT | Day/Month | HKT |
| 8 / 1 | 0210 | 8 / 1 | 1200 |
| 11 / 1 | 0845 | 12 / 1 | 1130 |
| 16 / 1 | 2315 | 17 / 1 | 0745 |
| Colour | Beginning Time | Ending Time | ||
|---|---|---|---|---|
| Day/Month | HKT | Day/Month | HKT | |
| Red | 30 / 12 | 0600 | 2 / 1 | 2000 |
| Yellow | 3 / 1 | 0600 | 3 / 1 | 2000 |
| Yellow | 7 / 1 | 0600 | 8 / 1 | 0600 |
| Red | 8 / 1 | 0600 | 14 / 1 | 2300 |
| Yellow | 15 / 1 | 0800 | 15 / 1 | 2030 |
| Yellow | 16 / 1 | 0930 | 16 / 1 | 1900 |
| Red | 17 / 1 | 0600 | 18 / 1 | 2230 |
| Yellow | 25 / 1 | 0600 | 25 / 1 | 1900 |
| Red | 28 / 1 | 0600 | 29 / 1 | 0600 |
| Yellow | 29 / 1 | 0600 | 29 / 1 | 2045 |
| Yellow | 30 / 1 | 0600 | 31 / 1 | 1945 |
| Beginning Time | Ending Time | ||
|---|---|---|---|
| Day/Month | HKT | Day/Month | HKT |
| 31 / 12 | 1630 | 1 / 1 | 0945 |
| 1 / 1 | 1630 | 2 / 1 | 0945 |
| 2 / 1 | 1630 | 3 / 1 | 0745 |
| 8 / 1 | 1630 | 9 / 1 | 0945 |
| 12 / 1 | 1630 | 13 / 1 | 1000 |
| 13 / 1 | 1630 | 14 / 1 | 0900 |
| Beginning Time | Ending Time | ||
|---|---|---|---|
| Day/Month | HKT | Day/Month | HKT |
| 29 / 12 | 1620 | 3 / 1 | 0930 |
| 7 / 1 | 1620 | 15 / 1 | 0845 |
| 17 / 1 | 1620 | 19 / 1 | 0945 |
| Meteorological Element | Figure of the Month | Departure from Normal (1991-2020) | Departure from Normal (1981-2010) |
|---|---|---|---|
| Mean Daily Maximum Air Temperature | 19.3 degrees C | 0.6 degree above normal | 0.7 degree above normal |
| Mean Air Temperature | 16.2 degrees C | 0.3 degree below normal | 0.1 degree below normal |
| Mean Daily Minimum Air Temperature | 13.8 degrees C | 0.8 degree below normal | 0.7 degree below normal |
| Mean Dew Point Temperature | 8.5 degrees C | 3.2 degrees below normal | 2.9 degrees below normal |
| Mean Relative Humidity | 62 % | 12 % below normal | 12 % below normal |
| Mean Cloud Amount | 47 % | 15 % below normal | 14 % below normal |
| Total Rainfall | Trace | 33.2 mm below normal | 24.7 mm below normal |
| Number of hours of Reduced VisibilityΔ | 78 hours | 135.6 hours below normal§ | 135.6 hours below normal§ |
| Total Bright Sunshine Duration | 217.3 hours | 71.5 hours above normal | 74.3 hours above normal |
| Mean Daily Global Solar Radiation | 14.43 Megajoule / square metre | 3.88 Megajoule above normal | 4.26 Megajoule above normal |
| Total Evaporation | 87.9 mm | 18.8 mm above normal | 16.6 mm above normal |
| Remarks : | All measurements were made at the Hong Kong Observatory except sunshine, solar radiation and evaporation which were recorded at King's Park Meteorological Station and visibility which was observed at the Hong Kong International Airport. |
| Δ |
The visibility readings at the Hong Kong International Airport are based on hourly observations by professional meteorological observers in 2004 and before, and average readings over the 10-minute period before the clock hour of the visibility meter near the middle of the south runway from 2005 onwards. The change of the data source in 2005 is an improvement of the visibility assessment using instrumented observations following the international trend. |
§ Departure from mean value between 1997 and 2020 |
|


| Remarks : | Extremely high: above 95th percentile Above normal: between 75th and 95th percentile Normal: between 25th and 75th percentile Below normal: between 5th and 25th percentile Extremely low: below 5th percentile Percentile and 5-day running average values are computed based on the data from 1991 to 2020 |
