The Weather of May 2018
4 June 2018
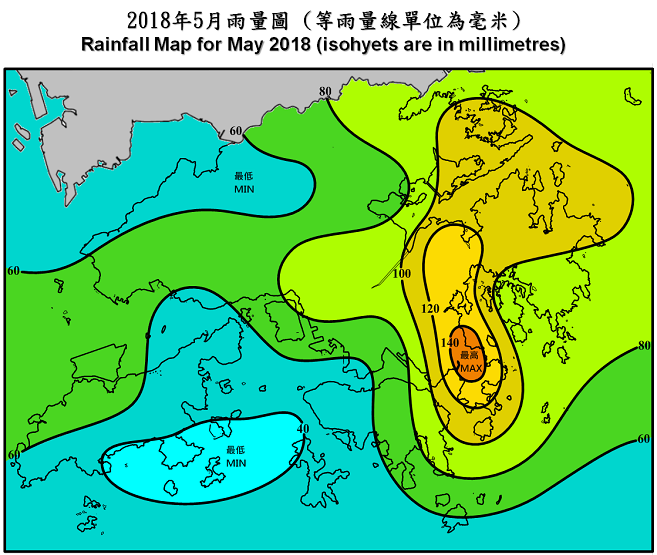
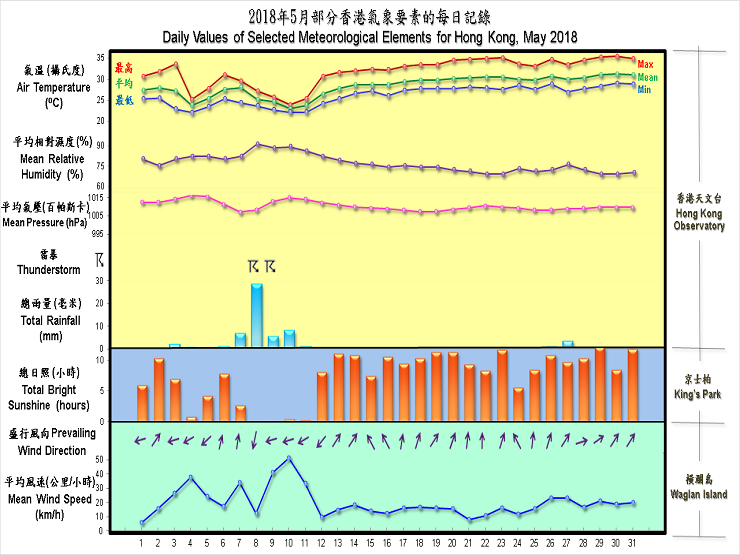
Under the dominance of an upper-air anticyclone over the northern part of the South China Sea, Hong Kong experienced an exceptionally hot and dry May with a 20-day fine spell that lasted till the end of the month. The monthly mean temperature of 28.3 degrees and monthly mean minimum temperature of 26.1 degrees were 2.4 degrees and 2.0 degrees above their respective normals and were the highest ever on record for May. The mean maximum temperature of 31.7 degrees was 3.3 degrees above normal and the second highest on record for May. There were in total 16 very hot days, including a heat wave of 15 consecutive very hot days that started from 17 May, and 6 hot nights in the month, all breaking the records for May. The total duration of bright sunshine was 236.9 hours, 96.5 hours above the normal of 140.4 hours and the fourth highest on record for May. The mean cloud amount of 62% and the mean relative humidity of 77% were respectively the joint fifth and joint third lowest on record for May. Rainfall in the month amounted to only 57.5 millimetres, less than one-fifth of the normal of 304.7 millimetres. The accumulated rainfall recorded in the first five months of the year was 175.0 millimetres, a deficit of 73 percent compared to the normal of 640.8 millimetres and the second lowest record for the same period.
Apart from some isolated showers and coastal fog on 1 May, the month began with generally fine weather. After a very hot day on 3 May, the weather turned cloudy with some scattered showers towards the evening as winds strengthened from the east. The easterly airstream brought much cooler conditions and the month’s lowest temperature of 22.1 degrees on 4 May. As the easterly airstream subsided, the weather turned brighter over the next couple of days despite the occurrence of some showers, particularly over the eastern part of the territory on 6 May.
As a trough of low pressure over Guangdong moved towards the coastal areas, the weather in Hong Kong turned cloudy with showers and thunderstorms later on 7 May. More than 50 millimetres of rain fell over Hong Kong Island and Sai Kung on the morning of 8 May as the trough swept across the territory. Cloudy and showery conditions continued for the next three days as a strengthening easterly airstream once again brought cooler weather to the south China coastal areas.
With the easterly airstream subsiding and an upper-air anticyclone becoming firmly established over the northern part of the South China Sea, a spell of fine weather set in on 12 May and persisted till the end of the month in Hong Kong. The territory was mostly rain-free during the period, apart from some isolated showers on 21, 22, 25 and 30 May and the weather becoming more showery on the mornings of 26 and 27 May as a trough of low pressure developed over southern China. With long hours of sunshine, a heat wave tightened its grip on the territory in the latter half of the month with daytime temperature at the Hong Kong Observatory reaching 33.0 degrees or above for 15 consecutive days from 17 to 31 May and soaring to a peak of 35.4 degrees on 30 May, the highest of the month and the second highest on record for May. The Very Hot Weather Warning remained in force for more than 320 hours, a record since the introduction of the warning in 2000.
There was no tropical cyclone over the South China Sea and the western North Pacific in the month.
Details of issuance and cancellation of various warnings/signals in the month are summarized in Tables 1.1 to 1.3. Monthly meteorological figures and departures from normal for May are tabulated in Table 2.
Warnings and Signals issued in May 2018
| Beginning Time | Ending Time | ||
|---|---|---|---|
| Day/Month | HKT | Day/Month | HKT |
| 3 / 5 | 2030 | 4 / 5 | 0445 |
| 4 / 5 | 1930 | 5 / 5 | 0140 |
| 9 / 5 | 1410 | 11 / 5 | 0245 |
| Beginning Time | Ending Time | ||
|---|---|---|---|
| Day/Month | HKT | Day/Month | HKT |
| 6 / 5 | 0635 | 6 / 5 | 0830 |
| 7 / 5 | 0810 | 7 / 5 | 1200 |
| 7 / 5 | 2230 | 8 / 5 | 1130 |
| 8 / 5 | 1507 | 8 / 5 | 1700 |
| 9 / 5 | 0420 | 9 / 5 | 1330 |
| 26 / 5 | 0205 | 26 / 5 | 0325 |
| 27 / 5 | 0300 | 27 / 5 | 0430 |
| 27 / 5 | 1230 | 27 / 5 | 1330 |
| 27 / 5 | 1600 | 27 / 5 | 1700 |
| Beginning Time | Ending Time | ||
|---|---|---|---|
| Day/Month | HKT | Day/Month | HKT |
| 3 / 5 | 1155 | 3 / 5 | 1415 |
| 15 / 5 | 1145 | 15 / 5 | 1620 |
| 16 / 5 | 0645 | 16 / 5 | 1615 |
| 17 / 5 | 1410 | 17 / 5 | 1620 |
| 18 / 5 | 0645 | 1 / 6 | 1845 |
| Meteorological Element | Figure of the Month | Departure from Normal* |
|---|---|---|
| Mean Daily Maximum Air Temperature | 31.7 degrees C | 3.3 degrees above normal |
| Mean Air Temperature | 28.3 degrees C | 2.4 degrees above normal |
| Mean Daily Minimum Air Temperature | 26.1 degrees C | 2.0 degrees above normal |
| Mean Dew Point Temperature | 23.7 degrees C | 1.1 degrees above normal |
| Mean Relative Humidity | 77 % | 6 % below normal |
| Mean Cloud Amount | 62 % | 14 % below normal |
| Total Rainfall | 57.5 mm | 247.2 mm below normal |
| Number of hours of Reduced VisibilityΔ | 9 hours | 36.4 hours below normal§ |
| Total Bright Sunshine Duration | 236.9 hours | 96.5 hours above normal |
| Mean Daily Global Solar Radiation | 20.54 Megajoule / square metre | 6.35 Megajoule above normal |
| Total Evaporation | 149.6 mm | 38.9 mm above normal |
| Remarks : | All measurements were made at the Hong Kong Observatory except sunshine,
solar radiation and evaporation which were recorded at King's Park
Meteorological Station and visibility which was observed at the Hong
Kong International Airport. |
| Δ | The visibility readings at the Hong Kong International Airport are based on hourly observations by professional meteorological observers in 2004 and before, and average readings over the 10-minute period before the clock hour of the visibility meter near the middle of the south runway from 2005 onwards. The change of the data source in 2005 is an improvement of the visibility assessment using instrumented observations following the international trend.
|
* Departure from 1981 - 2010 climatological normal, except for number of hours of reduced visibility |
|
§ Departure from mean value between 1997 and 2017 |
|
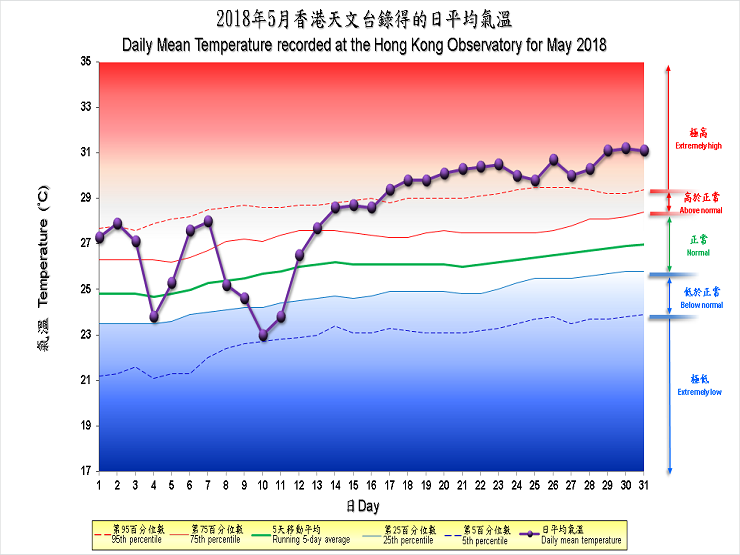
| Remarks : | Extremely high: above 95th percentile Above normal: between 75th and 95th percentile Normal: between 25th and 75th percentile Below normal: between 5th and 25th percentile Extremely low: below 5th percentile Percentile and 5-day running average values are computed based on the data from 1981 to 2010 |