The Weather of September 2017
4 October 2017
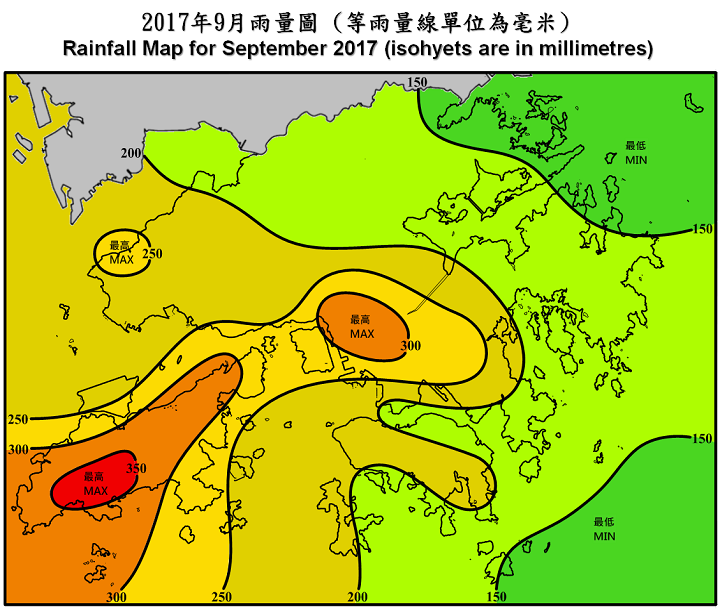
Hong Kong’s weather was unseasonably hot in September 2017. The monthly mean temperature was 29.0 degrees, 1.3 degrees above the normal figure of 27.7 degrees and one of the hottest September since record began in 1884. The month was also drier than usual with a total rainfall of 192.4 millimetres, about 59 percent of the normal figure of 327.6 millimetres. The accumulated rainfall this year up to September was 2441.3 millimetres, a surplus of 9 percent compared to the normal figure of 2233.1 millimetres for the same period.
Under the influence of a continental airstream, the weather in Hong Kong was hazy with sunny periods and evening thunderstorms on the first day of the month. Meanwhile, the tropical depression over the northeastern part of the South China Sea was named Mawar and intensified into a tropical storm. While lingering over the northeastern part of the South China Sea, Mawar further intensified into a severe tropical storm the next day. Mawar drifted towards the coast of eastern Guangdong slowly on 3 September and made landfall near Shanwei and weakened into a tropical storm on that night. Mawar moved across inland Guangdong on the morning of 4 September and weakened into an area of low pressure progressively during that day. Affected by the rainbands associated with Mawar, there were squally heavy showers and thunderstorms over the territory on 2-4 September. Local winds strengthened while Mawar skirting more than 100 kilometres to the northeast of Hong Kong on the morning of 4 September. Temperatures at the Hong Kong Observatory also fell to a minimum of 25.3 degrees in that morning, the lowest of the month.
With a southerly airstream prevailing over the coast of Guangdong and the northern part of the South China Sea, local weather was a mixture of sunshine and showers on the ensuing six days. Under the influence of the anticyclone aloft, the weather in Hong Kong turned generally fine and hot apart from isolated showers on 11 September. While it was sunny and hazy on the morning of 12 September, convective activities triggered by high temperatures brought thundery showers to the territory in the afternoon. Affected by the northeast monsoon, it was mainly fine with isolated showers on 13-14 September.
Under the dominance of the anticyclone aloft, local weather was sunny and very hot with some haze on the ensuing five days. With the anticyclone aloft weakening gradually, there were some showers and thunderstorms on 20-21 September. The showery activities over the northern part of the South China Sea and the coast of Guangdong brought heavy and thundery morning showers to Hong Kong on the next two days.
Meanwhile, an area of low pressure over the central part of the South China Sea intensified into a tropical depression on the night of 23 September. The tropical depression moved west-northwest across the northern part of South China Sea on 24 September and made landfall over Hainan Island that night. Affected by the outer rainbands of the tropical depression, there were a few squally showers and thunderstorms on 24 September. Dominated by the anticyclone aloft, it remained generally fine and hot on 25-29 September. With abundant sunshine, temperatures at the Observatory soared to a maximum of 34.1 degrees on the afternoon of 28 September, the highest of the month. Affected by a fresh northeast monsoon, local weather became mainly cloudy with showers and a few thunderstorms in the morning on 30 September.
Six tropical cyclones occurred over the South China Sea and the western North Pacific in the month.
Warnings and Signals issued in September 2017
| Name of Tropical Cyclone |
Signal Number |
Beginning Time | Ending Time | ||
|---|---|---|---|---|---|
| Day/Month | HKT | Day/Month | HKT | ||
| MAWAR | 1 | 2 / 9 | 0220 | 3 / 9 | 2240 |
| 3 | 3 / 9 | 2240 | 4 / 9 | 1020 | |
| 1 | 4 / 9 | 1020 | 4 / 9 | 1410 | |
| no name | 1 | 23 / 9 | 2310 | 24 / 9 | 1920 |
| Beginning Time | Ending Time | ||
|---|---|---|---|
| Day/Month | HKT | Day/Month | HKT |
| 14 / 9 | 0315 | 14 / 9 | 1015 |
| 24 / 9 | 2145 | 25 / 9 | 0540 |
| Colour | Beginning Time | Ending Time | ||
|---|---|---|---|---|
| Day/Month | HKT | Day/Month | HKT | |
| Amber | 23 / 9 | 0800 | 23 / 9 | 0850 |
| Beginning Time | Ending Time | ||
|---|---|---|---|
| Day/Month | HKT | Day/Month | HKT |
| 1 / 9 | 1510 | 1 / 9 | 2000 |
| 2 / 9 | 1715 | 2 / 9 | 1915 |
| 2 / 9 | 2040 | 2 / 9 | 2245 |
| 3 / 9 | 0640 | 3 / 9 | 0730 |
| 3 / 9 | 1545 | 3 / 9 | 2345 |
| 4 / 9 | 0225 | 4 / 9 | 0730 |
| 5 / 9 | 0355 | 5 / 9 | 0530 |
| 7 / 9 | 1240 | 7 / 9 | 1520 |
| 8 / 9 | 1020 | 8 / 9 | 1200 |
| 9 / 9 | 0925 | 9 / 9 | 1030 |
| 9 / 9 | 1215 | 9 / 9 | 2145 |
| 10 / 9 | 0415 | 10 / 9 | 0715 |
| 10 / 9 | 0815 | 10 / 9 | 0915 |
| 10 / 9 | 1325 | 10 / 9 | 1500 |
| 12 / 9 | 1440 | 12 / 9 | 1930 |
| 13 / 9 | 1830 | 13 / 9 | 1930 |
| 20 / 9 | 1310 | 20 / 9 | 1415 |
| 21 / 9 | 0920 | 21 / 9 | 1130 |
| 21 / 9 | 1425 | 21 / 9 | 1530 |
| 22 / 9 | 0605 | 22 / 9 | 0900 |
| 23 / 9 | 0430 | 23 / 9 | 0900 |
| 24 / 9 | 0455 | 24 / 9 | 0630 |
| 24 / 9 | 0920 | 24 / 9 | 1205 |
| 30 / 9 | 0445 | 30 / 9 | 1130 |
| 30 / 9 | 2230 | 30 / 9 | 2335 |
| Beginning Time | Ending Time | ||
|---|---|---|---|
| Day/Month | HKT | Day/Month | HKT |
| 12 / 9 | 1115 | 12 / 9 | 1645 |
| 13 / 9 | 1310 | 14 / 9 | 1620 |
| 15 / 9 | 1245 | 17 / 9 | 1930 |
| 18 / 9 | 1320 | 18 / 9 | 1800 |
| 26 / 9 | 0645 | 29 / 9 | 1900 |
| Meteorological Element | Figure of the Month | Departure from Normal* |
|---|---|---|
| Mean Daily Maximum Air Temperature | 31.9 degrees C | 1.8 degree above normal |
| Mean Air Temperature | 29.0 degrees C | 1.3 degree above normal |
| Mean Daily Minimum Air Temperature |
27.2 degrees C | 1.4 degree above normal |
| Mean Dew Point Temperature | 25.0 degrees C | 1.6 degree above normal |
| Mean Relative Humidity | 80 % | 2 % above normal |
| Mean Cloud Amount | 65 % | 1 % below normal |
| Total Rainfall | 192.4 mm | 135.2 mm below normal |
| Number of hours of Reduced VisibilityΔ | 26 hours | 55.2 hours below normal§ |
| Total Bright Sunshine Duration | 187.1 hours | 14.8 hours above normal |
| Mean Daily Global Solar Radiation | 15.82 Megajoule / square metre |
1.21 Megajoule above normal |
| Total Evaporation | 103.8 mm | 22.1 mm below normal |
| Remarks : | All measurements were made at the Hong Kong Observatory except sunshine,
solar radiation and evaporation which were recorded at King's Park
Meteorological Station and visibility which was observed at the Hong
Kong International Airport. |
| Δ | The visibility readings at the Hong Kong International Airport are based on hourly observations by professional meteorological observers in 2004 and before, and average readings over the 10-minute period before the clock hour of the visibility meter near the middle of the south runway from 2005 onwards. The change of the data source in 2005 is an improvement of the visibility assessment using instrumented observations following the international trend.
|
* Departure from 1981 - 2010 climatological normal, except for number of hours of reduced visibility |
|
§ Departure from mean value between 1997 and 2016 |
|
& Data incomplete |
|
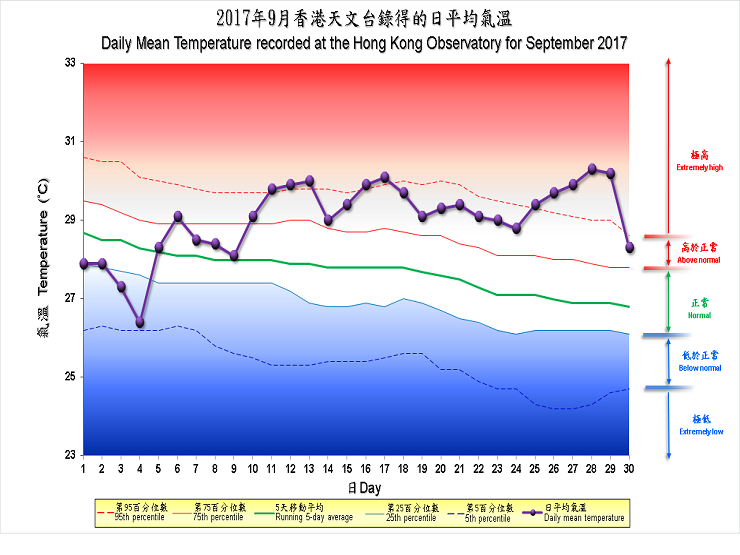
| Remarks : | Extremely high: above 95th percentile Above normal: between 75th and 95th percentile Normal: between 25th and 75th percentile Below normal: between 5th and 25th percentile Extremely low: below 5th percentile Percentile and 5-day running average values are computed based on the data from 1981 to 2010 |