The Weather of August 2017
4 September 2017
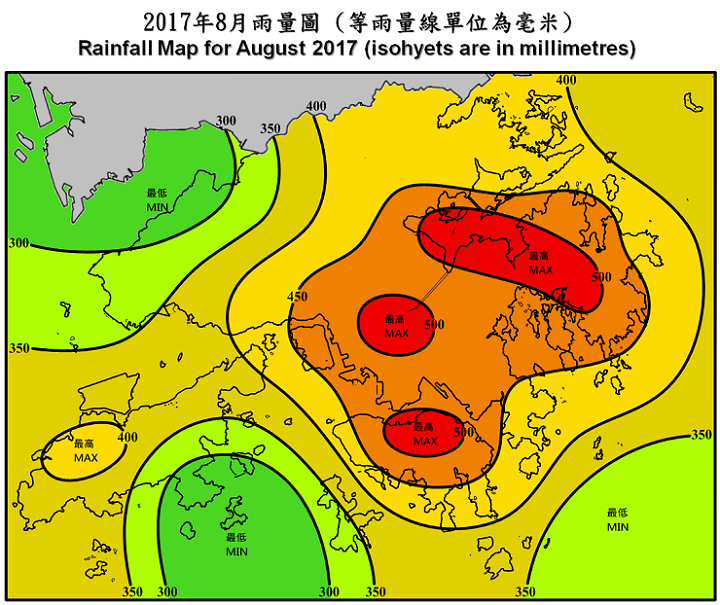
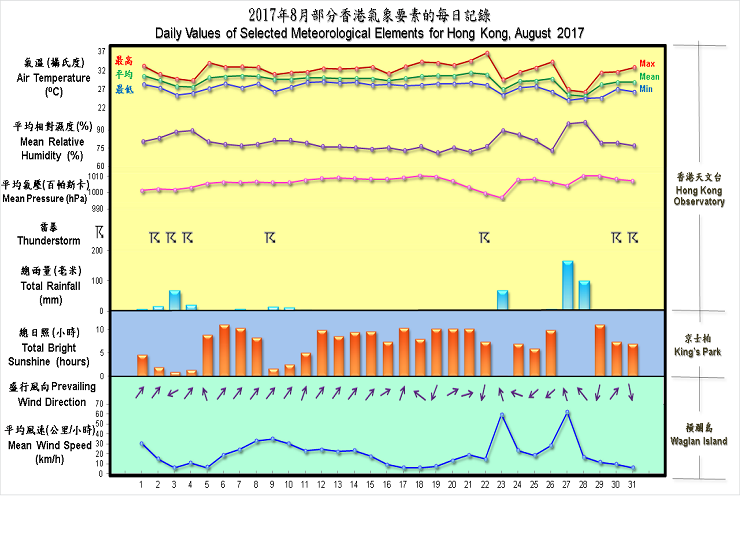
August 2017 was hotter than normal and the prolonged heat was relieved by the successive strikes of tropical cyclones Hato and Pakhar within a 5-day period during the latter part of the month. Both cyclones led to the raising of Gale or Storm Signal No.8, with Hato even necessitating the issuance of the Hurricane Signal No.10 on 23 August, the first time since July 2012. The mean temperature recorded in the month was 29.3 degrees, the seventh highest for August on record and 0.7 degree above the August normal of 28.6 degrees. Due to the rain brought by Hato and in particular Pakhar, the monthly total rainfall amounted to 489.1 millimetres, about 13 percent more than the normal figure of 432.2 millimetres. The accumulated rainfall this year up to August was 2248.9 millimetres, a surplus of 18 percent compared to the normal figure of 1905.5 millimetres for the same period.
Under the influence of an active southwest monsoon, the weather in Hong Kong was generally cloudy with morning showers that affected mostly the southeastern part of the territory on the first two days of the month. The showers got heavier and became more widespread on the morning of 3 August, leading to the issuance of the Red Rainstorm Warning Signal. After another showery morning on 4 August, particularly over the southern and southeastern part of the territory, the weather turned sunny and very hot on 5 August as a ridge of high pressure extended over southeastern China. Generally fine and very hot conditions then persisted for another three days.
With a freshening of the southwest monsoon, the weather turned cloudy on 9 August and showery activities increased. A southwest-to-northeast corridor of heavier showers extended from Tsuen Wan to the Tolo Harbour on 10 August, and then shifted eastwards the next day running from Hong Kong Island to Sai Kung. As the monsoon winds subsided, convective development became less active on 12 August despite some localized showers over Lantau Island. A spell of fine weather then prevailed for the next ten days, with a ridge of high pressure extending westwards from the Pacific to cover southeastern China on 16 – 18 August. Despite an outbreak of thundery showers due to intense day heating at Tai Po on 18 August, showers during the fine spell were mostly isolated and the territory enjoyed two shower-free days on 20 and 21 August.
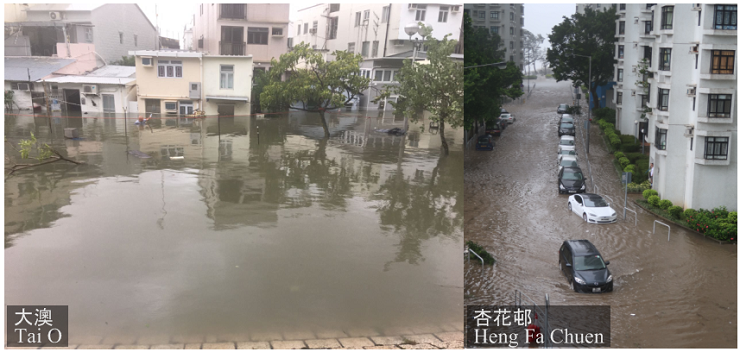
With prolonged sunshine, daytime temperatures at the Hong Kong Observatory reached 33 degrees or higher during the latter part of the fine spell. As Hato headed towards Hong Kong, subsidence effect ahead of its circulation brought hazy skies and oppressive heat on 22 August. The maximum temperature at the Hong Kong Observatory that afternoon soared to an all-time record-breaking high of 36.6 degrees. Squally showers associated with the outer rainbands of Hato then started to affect the territory later that day. The situation deteriorated further overnight as stormy weather battered the city during the passage of Hato on the morning of 23 August. Hurricane force winds affected Cheung Chau and the southeastern part of the territory, and a maximum gust of 193 kilometres per hour was recorded at Waglan Island. As the approach of Hato coincided with the astronomical high tide, storm surge induced by Hato resulted in unusually high water level and serious flooding in many parts of the territory, including Tai O, Heng Fa Chuen, Lei Yue Mun, Sha Tin and Lau Fau Shan. The water level at Quarry Bay rose to a maximum of 3.57 metres that morning, the second highest after the record high of 3.96 metres set by Super Typhoon Wanda in 1962. With Hato making landfall over Zhuhai to the west of Macau in the afternoon and weakening further inland, local winds subsided significantly later in the day.
The weather was a mixture of sunshine and scattered showers over the next couple of days, with some heavy showers affecting Tuen Mun and Shek Kong on 25 August. Ahead of the visit of Pakhar, oppressively hot and hazy conditions affected Hong Kong once again on 26 August. Rain and squalls associated with the intense rainbands north of Pakhar started to affect the territory later that evening. Stormy weather persisted for most of the day on 27 August as Pakhar skirted past just to the southwest of Hong Kong, with winds persistently reaching storm force over the northeastern and southern parts of the territory and occasionally attaining hurricane force on high ground. Temperature at the Hong Kong Observatory fell to the month’s lowest of 24.0 degrees in rain that day. Heavy showers and some squally thunderstorms continued to affect the territory the next day as winds gradually subsided. As the lingering rainbands associated with Pakhar finally cleared away, the weather turned sunny on 29 August. Hot conditions with a mixture of sunshine, haze and thundery evening showers then persisted towards the end of the month.
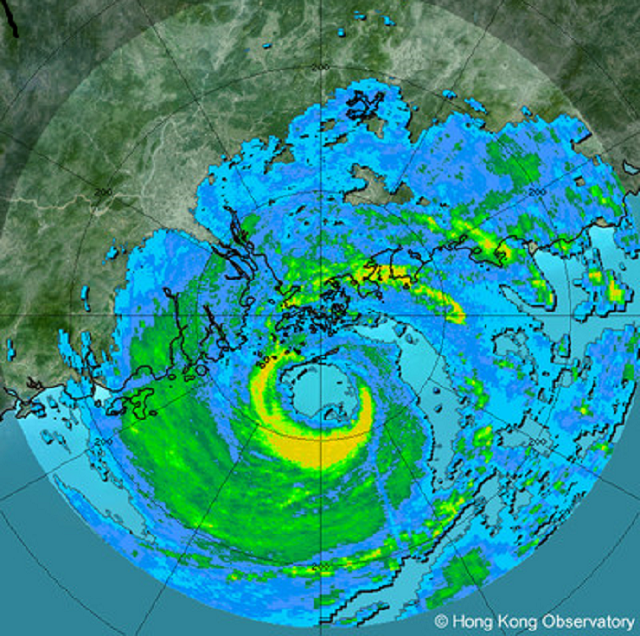
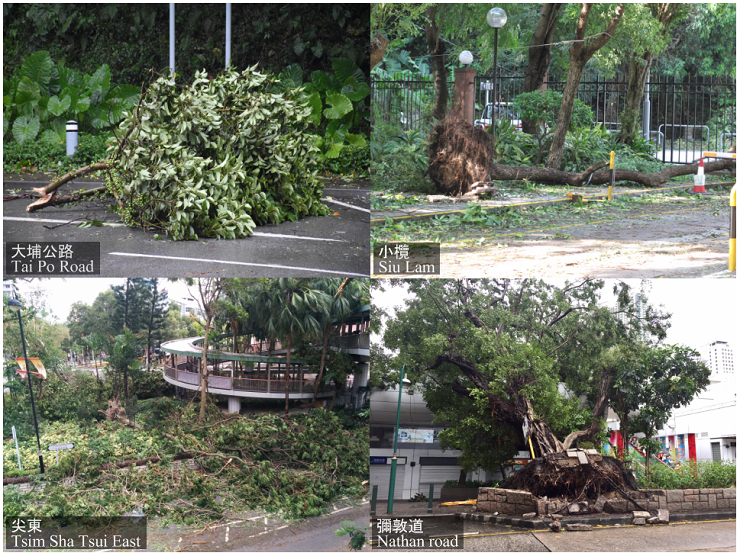
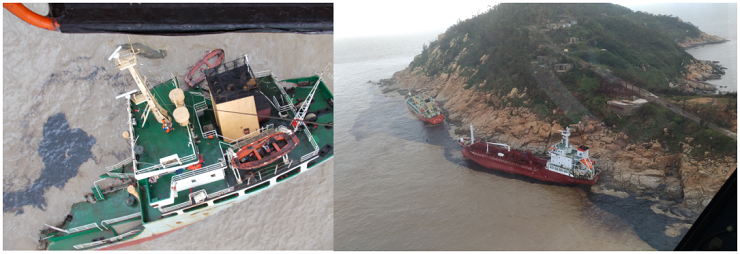
Seven tropical cyclones occurred over the South China Sea and the western North Pacific in the month.
Details of issuance and cancellation of various warnings/signals in the month are summarized in Tables 1.1 to 1.6. Monthly meteorological figures and departures from normal for August are tabulated in Table 2.
Warnings and Signals issued in August 2017
| Name of Tropical Cyclone |
Signal Number |
Beginning Time | Ending Time | ||
|---|---|---|---|---|---|
| Day/Month | HKT | Day/Month | HKT | ||
| HATO | 1 | 22 / 8 | 0840 | 22 / 8 | 1820 |
| 3 | 22 / 8 | 1820 | 23 / 8 | 0520 | |
| 8 NE | 23 / 8 | 0520 | 23 / 8 | 0810 | |
| 9 | 23 / 8 | 0810 | 23 / 8 | 0910 | |
| 10 | 23 / 8 | 0910 | 23 / 8 | 1410 | |
| 8 SE | 23 / 8 | 1410 | 23 / 8 | 1710 | |
| 3 | 23 / 8 | 1710 | 23 / 8 | 1820 | |
| 1 | 23 / 8 | 1820 | 23 / 8 | 2040 | |
| PAKHAR | 1 | 26 / 8 | 0940 | 26 / 8 | 2040 |
| 3 | 26 / 8 | 2040 | 27 / 8 | 0510 | |
| 8 SE | 27 / 8 | 0510 | 27 / 8 | 1340 | |
| 3 | 27 / 8 | 1340 | 27 / 8 | 1740 | |
| 1 | 27 / 8 | 1740 | 27 / 8 | 2210 | |
| Beginning Time | Ending Time | ||
|---|---|---|---|
| Day/Month | HKT | Day/Month | HKT |
| 28 / 8 | 0245 | 28 / 8 | 0440 |
| Colour | Beginning Time | Ending Time | ||
|---|---|---|---|---|
| Day/Month | HKT | Day/Month | HKT | |
| Amber | 3 / 8 | 0505 | 3 / 8 | 0530 |
| Red | 3 / 8 | 0530 | 3 / 8 | 0705 |
| Amber | 3 / 8 | 0705 | 3 / 8 | 0745 |
| Amber | 4 / 8 | 0620 | 4 / 8 | 0820 |
| Amber | 23 / 8 | 0800 | 23 / 8 | 1210 |
| Amber | 27 / 8 | 0510 | 27 / 8 | 1410 |
| Amber | 28 / 8 | 0615 | 28 / 8 | 0855 |
| Beginning Time | Ending Time | ||
|---|---|---|---|
| Day/Month | HKT | Day/Month | HKT |
| 27 / 8 | 1610 | 27 / 8 | 2315 |
| Beginning Time | Ending Time | ||
|---|---|---|---|
| Day/Month | HKT | Day/Month | HKT |
| 1 / 8 | 0630 | 1 / 8 | 1000 |
| 2 / 8 | 0250 | 2 / 8 | 1400 |
| 3 / 8 | 0030 | 3 / 8 | 0130 |
| 3 / 8 | 0325 | 3 / 8 | 0815 |
| 3 / 8 | 1555 | 3 / 8 | 1700 |
| 4 / 8 | 0515 | 4 / 8 | 1115 |
| 6 / 8 | 1210 | 6 / 8 | 1245 |
| 7 / 8 | 0715 | 7 / 8 | 0830 |
| 9 / 8 | 0750 | 9 / 8 | 1000 |
| 9 / 8 | 1215 | 9 / 8 | 1400 |
| 10 / 8 | 0305 | 10 / 8 | 0340 |
| 10 / 8 | 0555 | 10 / 8 | 1230 |
| 10 / 8 | 1355 | 10 / 8 | 1515 |
| 12 / 8 | 0345 | 12 / 8 | 0430 |
| 16 / 8 | 1035 | 16 / 8 | 1340 |
| 18 / 8 | 1415 | 18 / 8 | 1500 |
| 22 / 8 | 1235 | 22 / 8 | 1845 |
| 23 / 8 | 0700 | 23 / 8 | 1500 |
| 25 / 8 | 1235 | 25 / 8 | 1500 |
| 26 / 8 | 0225 | 26 / 8 | 0330 |
| 26 / 8 | 1850 | 26 / 8 | 2000 |
| 26 / 8 | 2120 | 26 / 8 | 2330 |
| 27 / 8 | 1155 | 27 / 8 | 2000 |
| 27 / 8 | 2300 | 28 / 8 | 1730 |
| 30 / 8 | 1550 | 30 / 8 | 1700 |
| 30 / 8 | 1825 | 30 / 8 | 2045 |
| 31 / 8 | 1730 | 31 / 8 | 2100 |
| Beginning Time | Ending Time | ||
|---|---|---|---|
| Day/Month | HKT | Day/Month | HKT |
| 1 / 8 | 1200 | 1 / 8 | 1830 |
| 5 / 8 | 1215 | 9 / 8 | 1100 |
| 11 / 8 | 1145 | 15 / 8 | 1945 |
| 17 / 8 | 1500 | 22 / 8 | 1800 |
| 24 / 8 | 1145 | 24 / 8 | 1930 |
| 26 / 8 | 0645 | 26 / 8 | 1800 |
| 30 / 8 | 0645 | 31 / 8 | 0130 |
| Meteorological Element | Figure of the Month | Departure from Normal* |
|---|---|---|
| Mean Daily Maximum Air Temperature | 32.1 degrees C | 1.0 degree above normal |
| Mean Air Temperature | 29.3 degrees C | 0.7 degree above normal |
| Mean Daily Minimum Air Temperature | 27.3 degrees C | 0.7 degree above normal |
| Mean Dew Point Temperature | 25.3 degrees C | 0.3 degree above normal |
| Mean Relative Humidity | 80 % | 1 % below normal |
| Mean Cloud Amount | 70 % | 1 % above normal |
| Total Rainfall | 489.1 mm | 56.9 mm above normal |
| Number of hours of Reduced VisibilityΔ | 8 hours | 40.4 hours below normal§ |
| Total Bright Sunshine Duration | 205.4 hours | 16.5 hours above normal |
| Mean Daily Global Solar Radiation | 17.92 Megajoule / square metre | 2.29 Megajoule above normal |
| Total Evaporation | 127.9 mm | 7.0 mm below normal |
| Remarks : | All measurements were made at the Hong Kong Observatory except sunshine,
solar radiation and evaporation which were recorded at King's Park
Meteorological Station and visibility which was observed at the Hong
Kong International Airport. |
| Δ | The visibility readings at the Hong Kong International Airport are based on hourly observations by professional meteorological observers in 2004 and before, and average readings over the 10-minute period before the clock hour of the visibility meter near the middle of the south runway from 2005 onwards. The change of the data source in 2005 is an improvement of the visibility assessment using instrumented observations following the international trend.
|
* Departure from 1981 - 2010 climatological normal, except for number of hours of reduced visibility |
|
§ Departure from mean value between 1997 and 2016 |
|
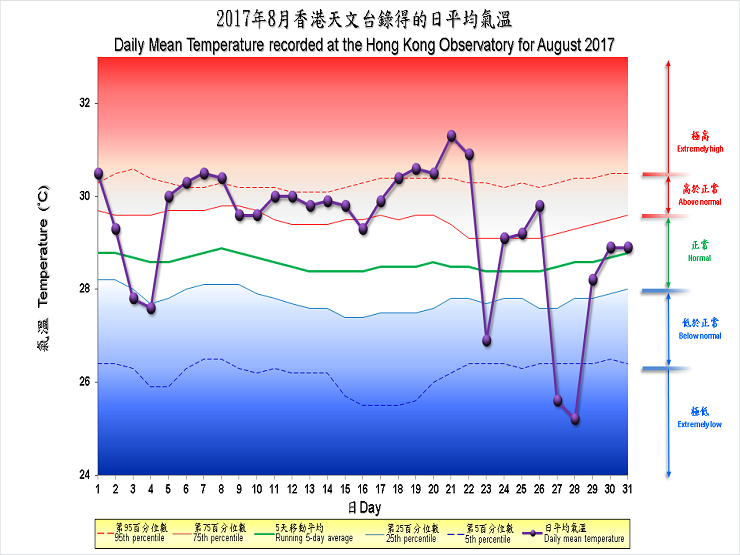
| Remarks : | Extremely high: above 95th percentile Above normal: between 75th and 95th percentile Normal: between 25th and 75th percentile Below normal: between 5th and 25th percentile Extremely low: below 5th percentile Percentile and 5-day running average values are computed based on the data from 1981 to 2010 |
