The Weather of October 2016
2 November 2016
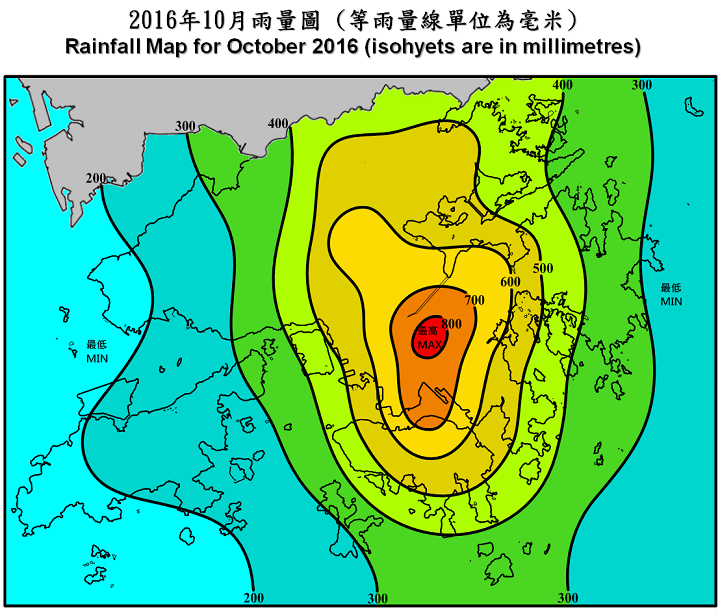
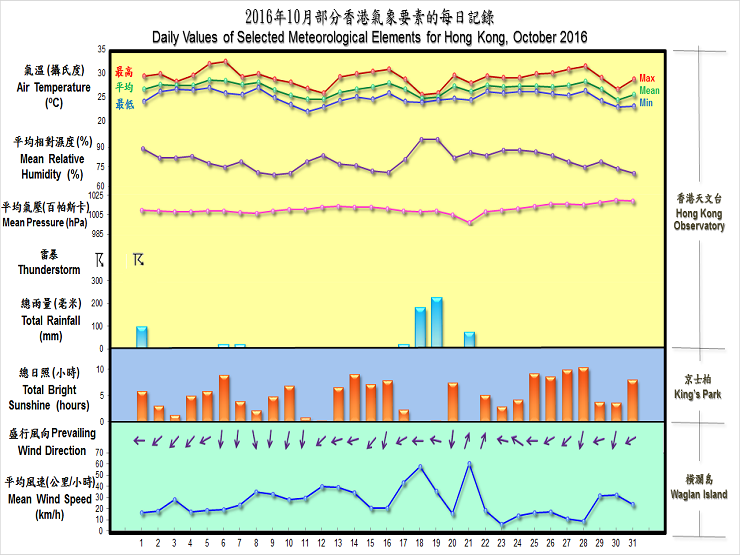
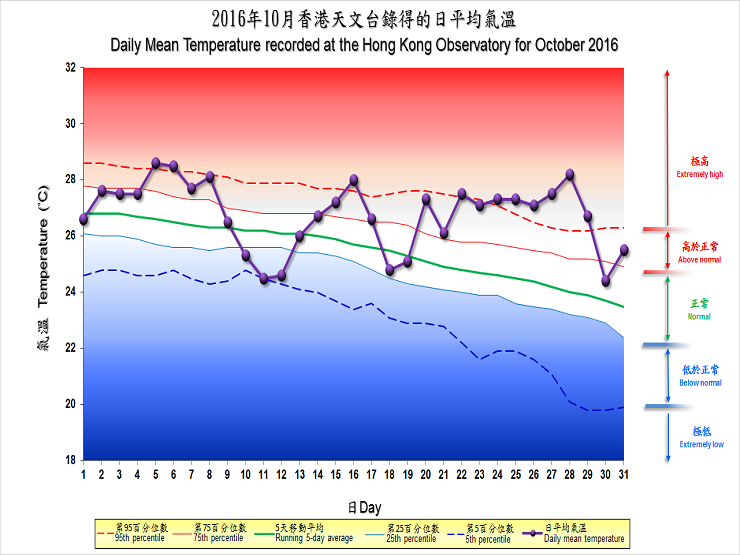
October 2016 was marked by record-breaking high mean temperatures, despite a succession of cyclonic systems passing by in the vicinity of Hong Kong and the duration of sunshine falling under 80 percent of the October normal. The monthly mean maximum temperature of 29.1 degrees, monthly mean temperature of 26.8 degrees and monthly mean minimum temperature of 25.0 degrees were all 1.3 degrees above their respective normals and were the highest ever on record for October. After the passage of the remnant circulation of Severe Typhoon Megi over southern China in late September, Tropical Storm Aere hovered for days over the coastal waters of Guangdong at the doorstep of Hong Kong in early October. Then came Super Typhoon Sarika and Super Typhoon Haima in less than a week between 16 and 21 October. The former brought torrential rain that broke the October hourly rainfall record and triggered the Black Rainstorm Warning on 19 October, while the latter led to the issuance of the No. 8 Gale or Storm Signal on 21 October. The monthly rainfall recorded at the Hong Kong Observatory was 624.4 millimetres, more than six times the October normal of 100.9 millimetres and the second highest on record for October. The accumulated rainfall of 2888.9 millimetres up to the end of October was about 24 percent above the normal figure of 2334.0 millimetres for the same period.
In the wake of Megi, unsettled weather prevailed over the coastal waters of Guangdong, with heavy showers and thunderstorms affecting Hong Kong early in the morning on 1 October. The Red Rainstorm Warning was issued as more than 70 millimetres of rainfall generally fell over the urban areas and the eastern part of the New Territories. Local weather was a combination of increasing sunshine and decreasing showers over the following four days as a weak low pressure system drifted southwestward off the coast of Guangdong and passed by to the south of Hong Kong. Meanwhile, Aere followed the weak low into the northeastern part of the South China Sea on 6 October and lingered for days to the southeast of Hong Kong before weakening into an area of low pressure on the night of 10 October. Locally, it was generally fine and hot during the day on 6 October and temperature at the Hong Kong Observatory rose to a maximum of 32.4 degrees, the highest of the month. After some showers that night, the weather gradually turned sunnier over the next four days.
As Aere weakened and drifted away towards Xisha, cooler air associated with the northeast monsoon gradually spread south towards the coastal areas of Guangdong. Temperature at the Hong Kong Observatory fell to a minimum of 22.0 degrees on 11 October, the lowest of the month. Local weather turned windier under a strong easterly airstream, and after some rain patches on 11 and 12 October, it became mainly fine over the next four days as the winds gradually subsided.
Meanwhile, Severe Typhoon Sarika moved across Luzon and entered the South China Sea on the morning of 16 October. Tracking west-northwestwards, Sarika made landfall over Hainan Island on the morning of 18 October and moved across Beibu Wan on 19 October. Under the combined effect of Sarika and the northeast monsoon over southern China, local weather became windy with squally showers on 17-19 October. The convergence between the northeast monsoon and the southerly airstream associated with Sarika triggered prolonged periods of heavy rain and thunderstorms on 18 and 19 October. The rain was most intense on the afternoon of 19 October, with more than 100 millimetres of rainfall falling generally over Hong Kong and rainfall even exceeding 200 millimetres over the urban areas, Shatin and Tai Po, necessitating the issuance of the first ever Black Rainstorm Warning in October since the Rainstorm Warning System commenced operation in 1992. The hourly rainfall of 78.7 millimetres recorded at the Hong Kong Observatory between 3 and 4 p.m. that day was also the highest in October since records began in 1884.
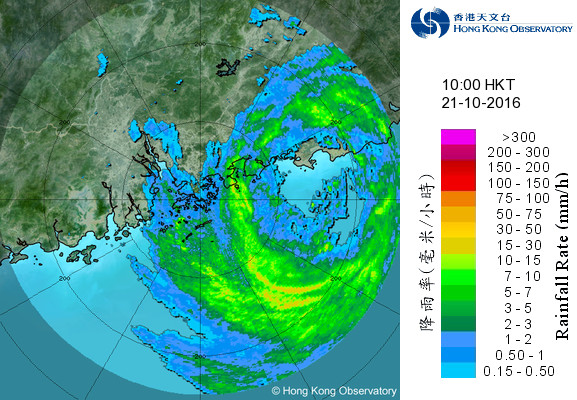
As Sarika dissipated over inland Guangxi, Super Typhoon Haima moved across Luzon and entered the northern part of the South China Sea on the morning of 20 October. Affected by the subsiding air ahead of Haima, it was mainly fine and hazy in Hong Kong that day. Haima weakened gradually into a typhoon as it edged towards the coast of eastern Guangdong and made landfall near Shanwei around noon on 21 October. With the approach of Haima, local winds strengthened significantly and reached gale force in many places during the day. The rainbands of Haima also brought squalls and heavy rain to Hong Kong. More than 100 millimetres of rainfall fell over Kowloon City, Wong Tai Sin and the eastern part of the New Territories. As Haima moved further inland, local weather improved with sunny periods and a few isolated showers over the next three days.
With the establishment of an upper-air anticyclone over southern China, local weather became fine and hot on 25-28 October. The passage of a cold front on 29 October brought cooler weather and some showers. The weather remained windy with sunny intervals the next day before mainly fine weather returned on the last day of the month as the monsoon winds subsided.


Five tropical cyclones occurred over the South China Sea and the western North Pacific in the month.
Details of issuance and cancellation of various warnings/signals in the month are summarized in Tables 1.1 to 1.7. Monthly meteorological figures and departures from normal for October are tabulated in Table 2.
Warnings and Signals issued in October 2016
| Name of Tropical Cyclone |
Signal Number |
Beginning Time | Ending Time | ||
|---|---|---|---|---|---|
| Day/Month | HKT | Day/Month | HKT | ||
| AERE | 1 | 6 / 10 | 2040 | 9 / 10 | 0345 |
| SARIKA | 1 | 16 / 10 | 2120 | 17 / 10 | 1340 |
| 3 | 17 / 10 | 1340 | 18 / 10 | 2210 | |
| HAIMA | 1 | 20 / 10 | 0820 | 20 / 10 | 2040 |
| 3 | 20 / 10 | 2040 | 21 / 10 | 0610 | |
| 8 NW | 21 / 10 | 0610 | 21 / 10 | 1415 | |
| 8 SW | 21 / 10 | 1415 | 21 / 10 | 1720 | |
| 3 | 21 / 10 | 1720 | 21 / 10 | 2210 | |
| Beginning Time | Ending Time | ||
|---|---|---|---|
| Day/Month | HKT | Day/Month | HKT |
| 12 / 10 | 2045 | 13 / 10 | 0745 |
| 13 / 10 | 2245 | 14 / 10 | 0740 |
| 18 / 10 | 2211 | 19 / 10 | 0845 |
| 29 / 10 | 1930 | 29 / 10 | 2215 |
| Colour | Beginning Time | Ending Time | ||
|---|---|---|---|---|
| Day/Month | HKT | Day/Month | HKT | |
| Amber | 1 / 10 | 0525 | 1 / 10 | 0555 |
| Red | 1 / 10 | 0555 | 1 / 10 | 0700 |
| Amber | 1 / 10 | 0700 | 1 / 10 | 0735 |
| Amber | 18 / 10 | 1525 | 18 / 10 | 1815 |
| Amber | 19 / 10 | 1300 | 19 / 10 | 1530 |
| Red | 19 / 10 | 1530 | 19 / 10 | 1600 |
| Black | 19 / 10 | 1600 | 19 / 10 | 1715 |
| Red | 19 / 10 | 1715 | 19 / 10 | 1815 |
| Amber | 19 / 10 | 1815 | 19 / 10 | 1930 |
| Beginning Time | Ending Time | ||
|---|---|---|---|
| Day/Month | HKT | Day/Month | HKT |
| 19 / 10 | 0920 | 19 / 10 | 2200 |
| Beginning Time | Ending Time | ||
|---|---|---|---|
| Day/Month | HKT | Day/Month | HKT |
| 1 / 10 | 0325 | 1 / 10 | 1015 |
| 1 / 10 | 1410 | 1 / 10 | 1445 |
| 4 / 10 | 0940 | 4 / 10 | 1115 |
| 4 / 10 | 1615 | 4 / 10 | 1715 |
| 6 / 10 | 2225 | 7 / 10 | 0130 |
| 19 / 10 | 1030 | 19 / 10 | 1830 |
| Colour | Beginning Time | Ending Time | ||
|---|---|---|---|---|
| Day/Month | HKT | Day/Month | HKT | |
| Yellow | 9 / 10 | 0600 | 9 / 10 | 2045 |
| Yellow | 10 / 10 | 0600 | 10 / 10 | 2100 |
| Yellow | 16 / 10 | 0600 | 16 / 10 | 1800 |
| Yellow | 30 / 10 | 0600 | 30 / 10 | 2230 |
| Beginning Time | Ending Time | ||
|---|---|---|---|
| Day/Month | HKT | Day/Month | HKT |
| 18 / 10 | 1730 | 18 / 10 | 2015 |
| 19 / 10 | 1325 | 19 / 10 | 2150 |
| Meteorological Element | Figure of the Month | Departure from Normal* |
|---|---|---|
| Mean Daily Maximum Air Temperature | 29.1 degrees C | 1.3 degrees above normal |
| Mean Air Temperature | 26.8 degrees C | 1.3 degrees above normal |
| Mean Daily Minimum Air Temperature | 25.0 degrees C | 1.3 degrees above normal |
| Mean Dew Point Temperature | 22.9 degrees C | 2.7 degrees above normal |
| Mean Relative Humidity | 80 % | 7 % above normal |
| Mean Cloud Amount | 74 % | 16 % above normal |
| Total Rainfall | 624.4 mm | 523.5 mm above normal |
| Number of hours of Reduced VisibilityΔ | 28 hours | 114.8 hours below normal§ |
| Total Bright Sunshine Duration | 152.6 hours | 41.3 hours below normal |
| Mean Daily Global Solar Radiation | 12.91 Megajoule / square metre | 1.14 Megajoule below normal |
| Total Evaporation | 95.2& mm | 28.7 mm below normal |
| Remarks : | All measurements were made at the Hong Kong Observatory except sunshine,
solar radiation and evaporation which were recorded at King's Park
Meteorological Station and visibility which was observed at the Hong
Kong International Airport. |
| Δ | The visibility readings at the Hong Kong International Airport are based on hourly observations by professional meteorological observers in 2004 and before, and average readings over the 10-minute period before the clock hour of the visibility meter near the middle of the south runway from 2005 onwards. The change of the data source in 2005 is an improvement of the visibility assessment using instrumented observations following the international trend.
|
* Departure from 1981 - 2010 climatological normal, except for number of hours of reduced visibility |
|
§ Departure from mean value between 1997 and 2015 |
|
& Data incomplete |
|
| Remarks : | Extremely high: above 95th percentile Above normal: between 75th and 95th percentile Normal: between 25th and 75th percentile Below normal: between 5th and 25th percentile Extremely low: below 5th percentile Percentile and 5-day running average values are computed based on the data from 1981 to 2010 |