The Weather of May 2016
2 June 2016
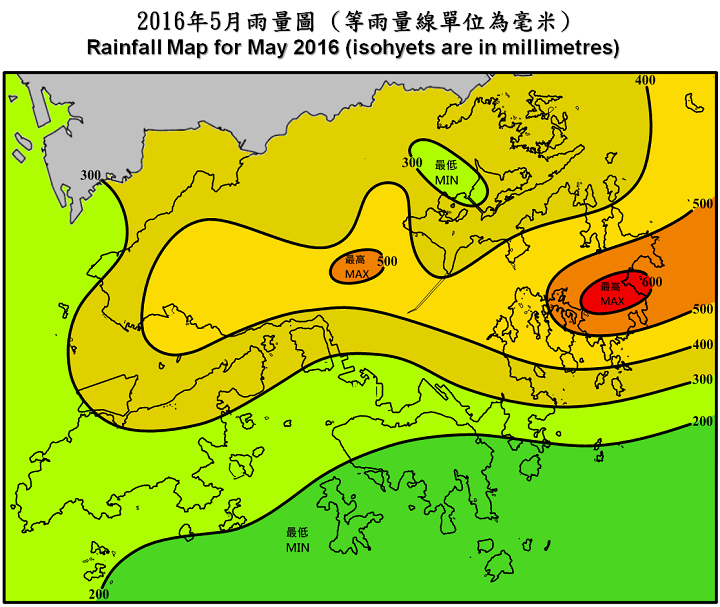
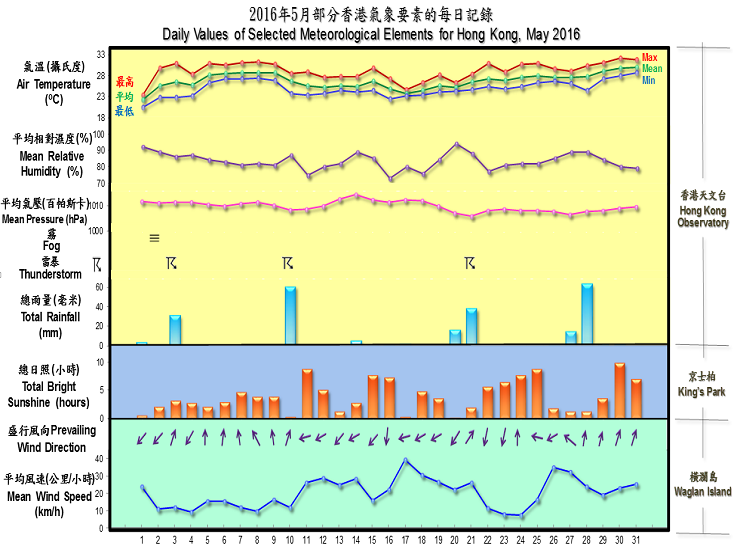
The weather for May 2016 was warmer and drier than usual. The monthly mean temperature was 26.7 degrees, 0.8 degree above the normal figure of 25.9 degrees. Despite several rainstorms in the month, the monthly total rainfall was only 233.6 millimetres, about 23 percent below the normal figure of 304.7 millimetres. However, the accumulated rainfall of 885.4 millimetres in the first five months of the year was still about 38 percent more than the normal figure of 640.8 millimetres for the same period.
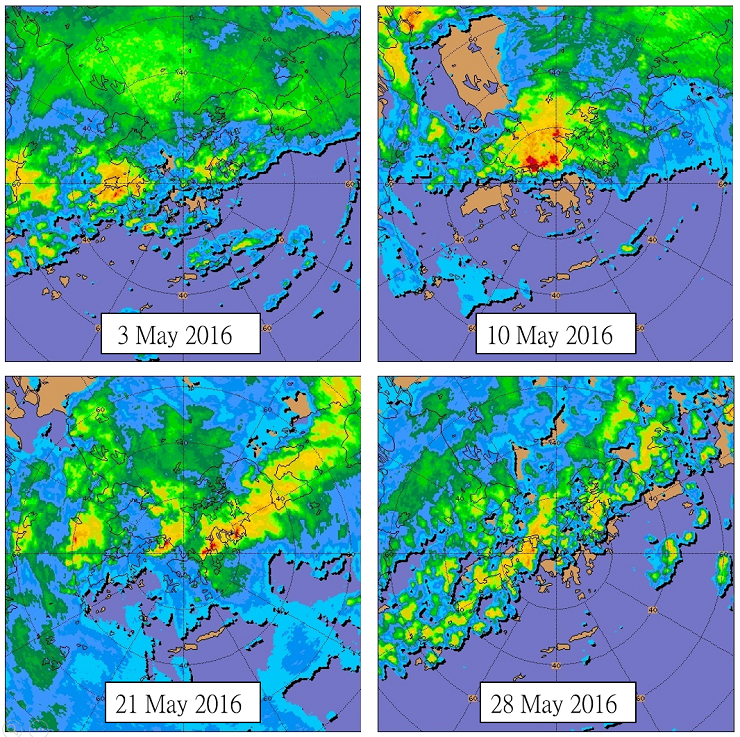
Under the influence of an easterly airstream, the weather in Hong Kong was slightly cooler with a few showers on 1 May. The minimum temperature of 20.4 degrees recorded at the Hong Kong Observatory that morning was the lowest of the month. With the easterly airstream gradually replaced by a warm and humid maritime airstream, local weather became warm and foggy with a few showers on 2 May. Affected by a trough of low pressure over the coastal areas of Guangdong, there were showers and thunderstorms in the next couple of days. The showers were particularly heavy on the evening of 3 May with more than 30 millimetres of rainfall recorded over many places of the territory.
Dominated by a southerly airstream, it was hot with sunny periods in Hong Kong from 5 to 9 May. An area of intense rain and thunderstorms associated with a trough of low pressure swept across the Pearl River estuary on 10 May. More than 70 millimetres of rainfall were generally recorded in Hong Kong, and rainfall over Sha Tin and Sai Kung even exceeded 150 millimetres. Red Rainstorm Warning Signal was twice issued that morning.
After a mainly fine and relatively dry day on 11 May, the weather became generally cloudy with isolated showers over the next three days as a fresh easterly airstream prevailed over the coast of Guangdong. With the moderation of the easterly airstream, the weather turned mostly fine on 15 May. Despite some light rain during the passage of a cold front that night, the weather remained fine the next day with slightly cooler temperatures as a relatively dry northerly airstream reached the coast of Guangdong. The freshening of easterly winds once again brought cloudy weather and some rain patches to Hong Kong on 17 – 19 May.
Affected by a trough of low pressure over the coast of Guangdong, local weather deteriorated with heavy showers and squally thunderstorms on 20 and 21 May. The rainstorm episode in the early morning on 21 May brought more than 70 millimetres of rainfall to many places, with rainfall exceeding 200 millimetres in Sai Kung where a few landslides were reported. With the weakening of the trough, local weather improved and it was generally fine and hot on 22 – 25 May.
The weather became windy and showery in Hong Kong as a monsoon depression over the northern part of the South China Sea developed into a tropical depression on the night of 26 May and Tropical Cyclone Warning Signal was issued for the first time this year. The tropical depression made landfall near Yangjiang over the coast of western Guangdong the next day as strong winds affected the territory. Under the influence of an active southwest monsoon in the wake of the tropical depression, local weather became even more unsettled with heavy showers and thunderstorms on 28 May. More than 40 millimetres of rainfall were generally recorded over the territory, and rainfall even exceeded 100 millimetres in Kwai Tsing and Tsuen Wan. During the heavy downpour, 16 hikers were stranded in Fanling due to flash flood and had to be led to safety by rescue workers.
With the moderation of the southwest monsoon, the weather became hot with sunny periods and a few showers towards the end of the month. Daytime temperature at the Hong Kong Observatory soared to 32.1 degrees on 30 May, the highest of the month.
One tropical cyclone occurred over the South China Sea and the western North Pacific in the month.
Details of issuance and cancellation of various warnings/signals in the month are summarized in Tables 1.1 to 1.5. Monthly meteorological figures and departures from normal for May are tabulated in Table 2.
Warnings and Signals issued in May 2016
| Name of Tropical Cyclone |
Signal Number |
Beginning Time | Ending Time | ||
|---|---|---|---|---|---|
| Day/Month | HKT | Day/Month | HKT | ||
| no name | 1 | 26 / 5 | 2140 | 27 / 5 | 0540 |
| 3 | 27 / 5 | 0540 | 27 / 5 | 1340 | |
| 1 | 27 / 5 | 1340 | 27 / 5 | 2250 | |
| Colour | Beginning Time | Ending Time | ||
|---|---|---|---|---|
| Day/Month | HKT | Day/Month | HKT | |
| Amber | 3 / 5 | 1810 | 3 / 5 | 2055 |
| Amber | 10 / 5 | 0600 | 10 / 5 | 0735 |
| Red | 10 / 5 | 0735 | 10 / 5 | 0935 |
| Amber | 10 / 5 | 0935 | 10 / 5 | 1120 |
| Red | 10 / 5 | 1120 | 10 / 5 | 1345 |
| Amber | 10 / 5 | 1345 | 10 / 5 | 1445 |
| Amber | 21 / 5 | 0155 | 21 / 5 | 0615 |
| Amber | 28 / 5 | 1635 | 28 / 5 | 1840 |
| Beginning Time | Ending Time | ||
|---|---|---|---|
| Day/Month | HKT | Day/Month | HKT |
| 3 / 5 | 1505 | 3 / 5 | 2200 |
| 4 / 5 | 1210 | 4 / 5 | 1330 |
| 6 / 5 | 2107 | 6 / 5 | 2230 |
| 10 / 5 | 0540 | 10 / 5 | 1345 |
| 12 / 5 | 1710 | 12 / 5 | 1815 |
| 15 / 5 | 1820 | 15 / 5 | 2200 |
| 20 / 5 | 1130 | 21 / 5 | 0700 |
| 28 / 5 | 1315 | 28 / 5 | 1930 |
| 29 / 5 | 0230 | 29 / 5 | 0330 |
| 30 / 5 | 1000 | 30 / 5 | 1100 |
| Beginning Time | Ending Time | ||
|---|---|---|---|
| Day/Month | HKT | Day/Month | HKT |
| 31 / 5 | 1145 | 4 / 6 | 1450 |
| Beginning Time | Ending Time | ||
|---|---|---|---|
| Day/Month | HKT | Day/Month | HKT |
| 10 / 5 | 0705 | 10 / 5 | 1300 |
| 21 / 5 | 0510 | 21 / 5 | 0740 |
| Meteorological Element | Figure of the Month | Departure from Normal* |
|---|---|---|
| Mean Daily Maximum Air Temperature | 29.1 degrees C | 0.7 degree above normal |
| Mean Air Temperature | 26.7 degrees C | 0.8 degree above normal |
| Mean Daily Minimum Air Temperature | 24.9 degrees C | 0.8 degree above normal |
| Mean Dew Point Temperature | 23.6 degrees C | 1.0 degree above normal |
| Mean Relative Humidity | 83 % | normal |
| Mean Cloud Amount | 78 % | 2 % above normal |
| Total Rainfall | 233.6 mm | 71.1 mm below normal |
| Number of hours of Reduced VisibilityΔ | 10 hours | 37.3 hours below normal§ |
| Total Bright Sunshine Duration | 122.2 hours | 18.2 hours below normal |
| Mean Daily Global Solar Radiation | 14.78 Megajoule / square metre | 0.59 Megajoule above normal |
| Total Evaporation | 105.0& mm | 5.7 mm below normal |
| Remarks : | All measurements were made at the Hong Kong Observatory except sunshine,
solar radiation and evaporation which were recorded at King's Park
Meteorological Station and visibility which was observed at the Hong
Kong International Airport. |
| Δ | The visibility readings at the Hong Kong International Airport are based on hourly observations by professional meteorological observers in 2004 and before, and average readings over the 10-minute period before the clock hour of the visibility meter near the middle of the south runway from 2005 onwards. The change of the data source in 2005 is an improvement of the visibility assessment using instrumented observations following the international trend.
|
* Departure from 1981 - 2010 climatological normal, except for number of hours of reduced visibility |
|
§ Departure from mean value between 1997 and 2015 |
|
& Data incomplete |
|
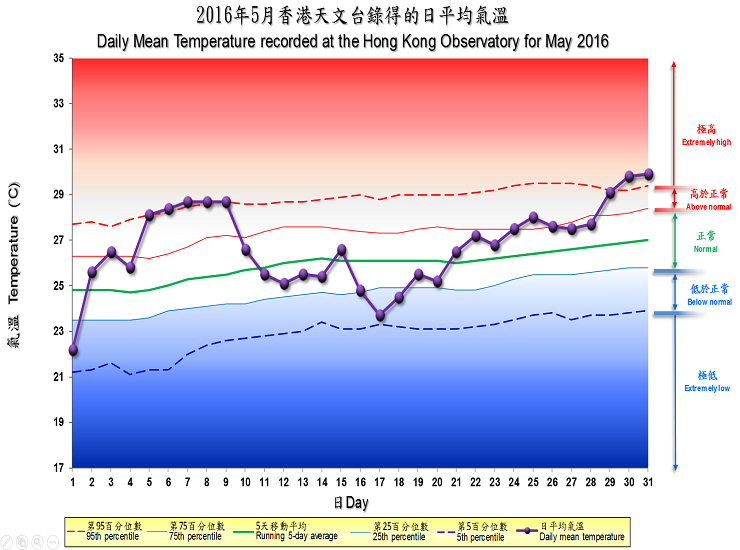
| Remarks : | Extremely high: above 95th percentile Above normal: between 75th and 95th percentile Normal: between 25th and 75th percentile Below normal: between 5th and 25th percentile Extremely low: below 5th percentile Percentile and 5-day running average values are computed based on the data from 1981 to 2010 |