The Weather of January 2016
2 February 2016
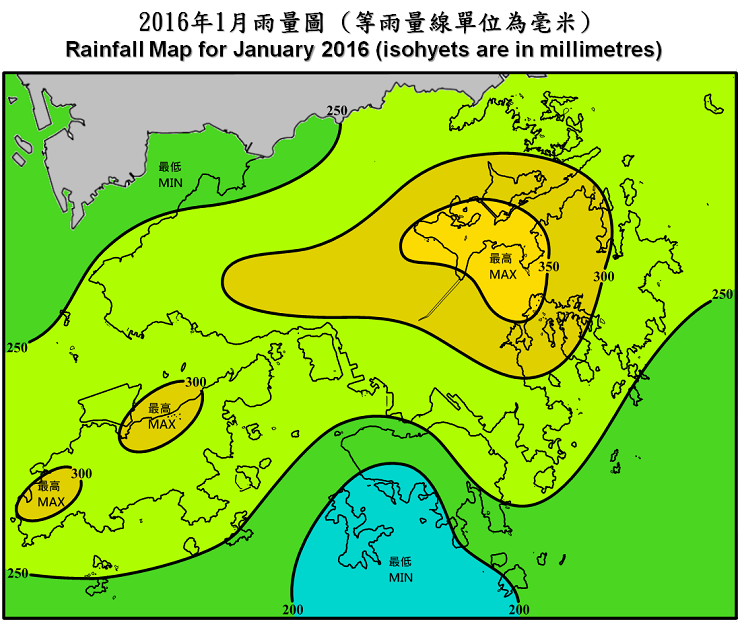
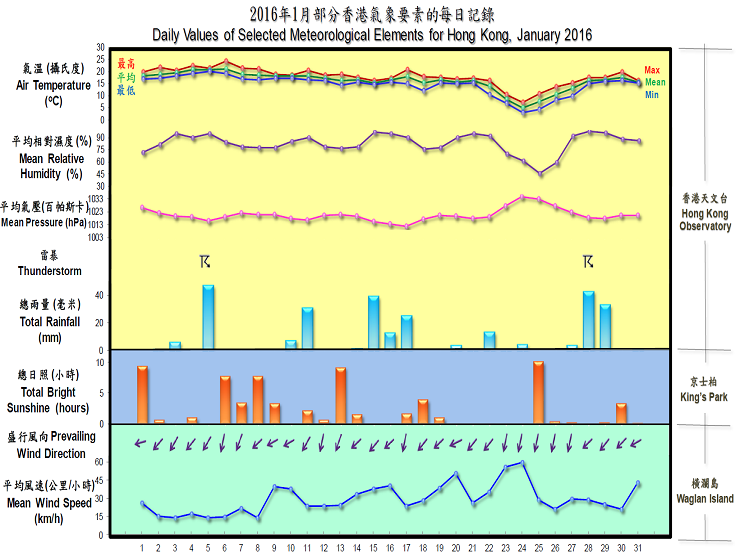
January 2016 was characterized by an intense cold surge in the latter part of the month and exceptionally high monthly rainfall. The unseasonably warm weather in the first three weeks of the month was totally offset by the freezing temperatures during the 3-day period of 23 - 25 January. The mean sea level pressure of 1037.7 hectopascals on 24 January was the highest ever recorded at the Observatory. Yet the monthly averaged temperature of 16.0 degrees turned out to be deceptively unremarkable, only 0.3 degree below normal. With upper-air disturbances repeatedly affecting the south China coastal areas and bringing outbreaks of heavy rain, the Observatory recorded an all-time high monthly rainfall of 266.9 millimetres, more than ten times the January normal of 24.7 millimetres and easily breaking the previous record of 214.3 millimetres set way back in January 1887. The heavy rain on 5 January also broke the hourly rainfall record for January.
Under the influence of a dry northeast monsoon, the weather in Hong Kong was mainly fine and dry on the first day of the month. A broad band of clouds over the northern part of the South China Sea brought a few rain patches on 2 January and the weather remained cloudy with mist and fog patches in the next two days as a humid maritime airstream set in over the territory. The visibility at Waglan Island once fell below 500 metres on the morning of 3 January.
An area of heavy rain and thunderstorms associated with an upper-air disturbance affected Hong Kong on the afternoon of 5 January and brought more than 30 millimetres of rainfall to the urban areas, the eastern part of Lantau Island, and the eastern part of the New Territories. The rain was particularly heavy between 1 p.m. and 2 p.m. with 37.0 millimetres of rainfall reported at the Observatory, the highest hourly rainfall for January on record. It also necessitated the issuance of the Amber Rainstorm Warning, the earliest since the rainstorm warning system commenced operation in 1992.
Despite some rain and mist patches on the morning of 6 January, the weather turned mainly fine during the day as a drier air mass reached the south China coastal areas, and remained so over the next couple of days. Meanwhile, easterly winds freshened on 9 January and the weather turned cloudier and cooler with rain on 10 - 11 January. A replenishment of the northeast monsoon reached the coast of Guangdong and temperatures dropped further in Hong Kong with relatively cool mornings on 12 and 13 January.
After a sunny day on 13 January, a prolonged spell of cloudy weather set in over the next 11 days. Rainbands associated with an upper-air disturbance and a cold front affected Hong Kong on 15 - 17 January with more than 75 millimetres of rainfall recorded at the Observatory during the period. After a rather cold morning and some sunny periods on 18 January, easterly winds strengthened over the next couple of days and brought more clouds and rain to Hong Kong.
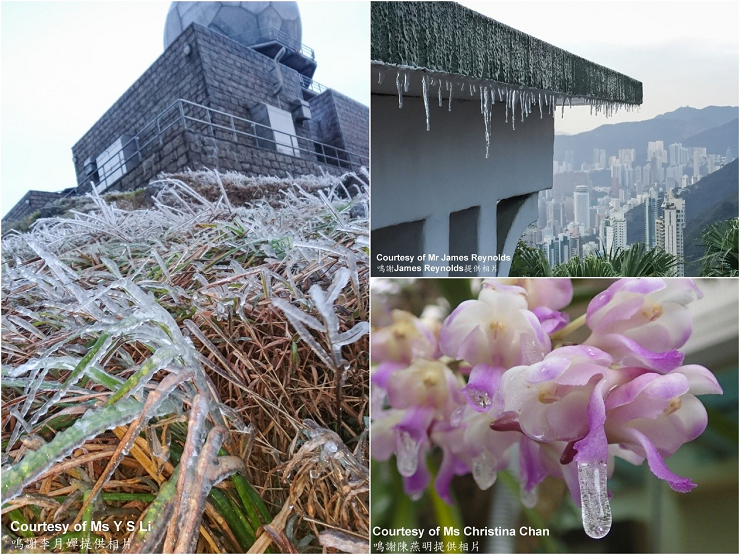
Meanwhile, an intense surge of cold air poured southwards across mainland China and reached the coast of Guangdong on 22 January, bringing appreciably colder weather with occasional rain. Temperatures in the urban areas fell to about 10 degrees that night and plunged further in the next couple of days as strong to gale force northerly winds raged across the coastal areas. Under bitterly cold and rainy conditions, the mean sea level pressure at the Observatory climbed to an all-time record high of 1037.7 hectopascals on 24 January and temperatures dropped further during the day to the month’s lowest of 3.1 degrees that afternoon, the coldest day since 1957 and the sixth lowest on record. Sub-zero temperatures were recorded on high ground with temperatures at Tai Mo Shan falling to a minimum of -6.0 degrees that day. There were widespread frost, rime, icing, freezing rain and ice pellets on high ground and in some parts of the New Territories. More than 120 people, mostly hikers and runners of a cross-country race stranded on Tai Mo Shan and nearby peaks due to icy roads and wintry weather, had to be rescued or led to safety, and over 60 were taken to hospitals for treatment with a number of them suffering from hypothermia.
Following a very cold morning on 25 January, sunny skies emerged that day as the northerly winds eventually brought a dry continental air mass to Hong Kong with relative humidity falling below 40 percent during the day. However, clouds and rain patches soon returned the next day as the dry air mass retreated, and the weather remained cold in the morning on 26 and 27 January despite a gradual rise in temperatures. Conditions became even more humid and unsettled on 28 - 29 January as another upper-air disturbance brought heavier rain and thunderstorms to the south China coastal areas. Under the influence of the northeast monsoon, generally cloudy and cool weather prevailed till the end of the month.


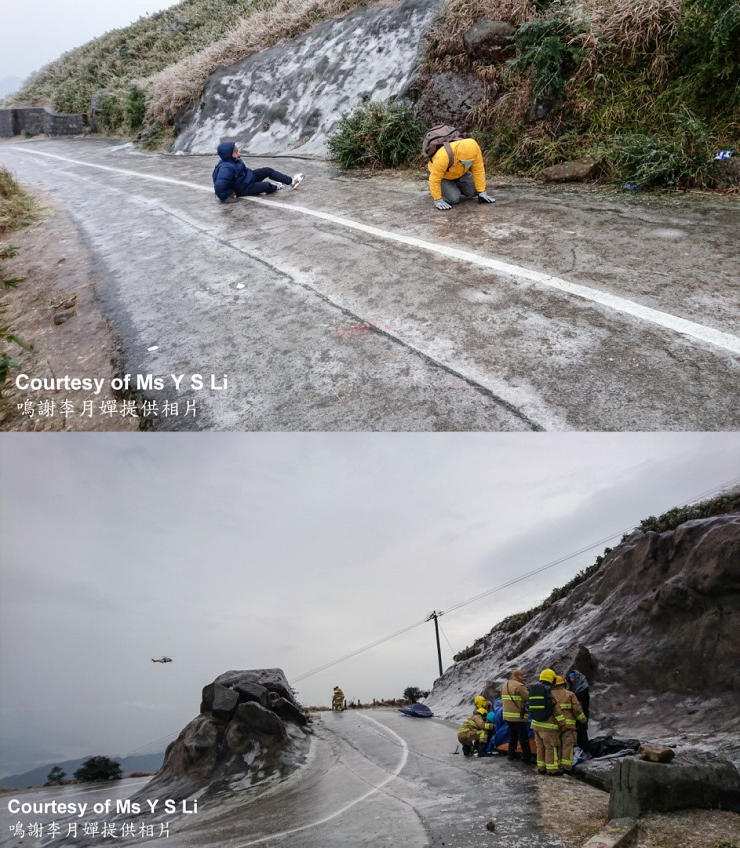
Bottom - Emergency services coming to the aid of trapped hikers at Tai Mo Shan
There was no tropical cyclone over the South China Sea and the western North Pacific in the month.
Details of issuance and cancellation of various warnings/signals in the month are summarized in Tables 1.1 to 1.6. Monthly meteorological figures and departures from normal for January are tabulated in Table 2.
Warnings and Signals issued in January 2016
| Beginning Time | Ending Time | ||
|---|---|---|---|
| Day/Month | HKT | Day/Month | HKT |
| 16 / 1 | 1140 | 17 / 1 | 0140 |
| 20 / 1 | 0310 | 21 / 1 | 0745 |
| 22 / 1 | 2130 | 25 / 1 | 1030 |
| 31 / 1 | 0430 | 31 / 1 | 1745 |
| Colour | Beginning Time | Ending Time | ||
|---|---|---|---|---|
| Day/Month | HKT | Day/Month | HKT | |
| Amber | 5 / 1 | 1400 | 5 / 1 | 1445 |
| Beginning Time | Ending Time | ||
|---|---|---|---|
| Day/Month | HKT | Day/Month | HKT |
| 5 / 1 | 1338 | 5 / 1 | 1500 |
| 28 / 1 | 0820 | 28 / 1 | 1200 |
| 28 / 1 | 2200 | 29 / 1 | 1200 |
| Colour | Beginning Time | Ending Time | ||
|---|---|---|---|---|
| Day/Month | HKT | Day/Month | HKT | |
| Yellow | 1 / 1 | 0600 | 1 / 1 | 2045 |
| Red | 25 / 1 | 0600 | 26 / 1 | 1315 |
| Beginning Time | Ending Time | ||
|---|---|---|---|
| Day/Month | HKT | Day/Month | HKT |
| 23 / 1 | 1200 | 26 / 1 | 0945 |
| Beginning Time | Ending Time | ||
|---|---|---|---|
| Day/Month | HKT | Day/Month | HKT |
| 18 / 1 | 0445 | 18 / 1 | 1145 |
| 21 / 1 | 1620 | 27 / 1 | 1215 |
| 31 / 1 | 1620 | 9 / 2 | 1000 |
| Meteorological Element | Figure of the Month | Departure from Normal* |
|---|---|---|
| Mean Daily Maximum Air Temperature | 17.8 degrees C | 0.8 degree below normal |
| Mean Air Temperature | 16.0 degrees C | 0.3 degree below normal |
| Mean Daily Minimum Air Temperature | 14.4 degrees C | 0.1 degree below normal |
| Mean Dew Point Temperature | 13.0 degrees C | 1.6 degrees above normal |
| Mean Relative Humidity | 83 % | 9 % above normal |
| Mean Cloud Amount | 79 % | 18 % above normal |
| Total Rainfall | 266.9 mm | 242.2 mm above normal |
| Number of hours of Reduced VisibilityΔ | 86 hours | 161.9 hours below normal§ |
| Total Bright Sunshine Duration | 67.1 hours | 75.9 hours below normal |
| Mean Daily Global Solar Radiation | 7.15 Megajoule / square metre | 3.02 Megajoule below normal |
| Total Evaporation | 44.4& mm | 26.9 mm below normal |
| Remarks : | All measurements were made at the Hong Kong Observatory except sunshine,
solar radiation and evaporation which were recorded at King's Park
Meteorological Station and visibility which was observed at the Hong
Kong International Airport. |
| Δ | The visibility readings at the Hong Kong International Airport are based on hourly observations by professional meteorological observers in 2004 and before, and average readings over the 10-minute period before the clock hour of the visibility meter near the middle of the south runway from 2005 onwards. The change of the data source in 2005 is an improvement of the visibility assessment using instrumented observations following the international trend.
|
* Departure from 1981 - 2010 climatological normal, except for number of hours of reduced visibility |
|
§ Departure from mean value between 1997 and 2015 |
|
& Data incomplete |
|
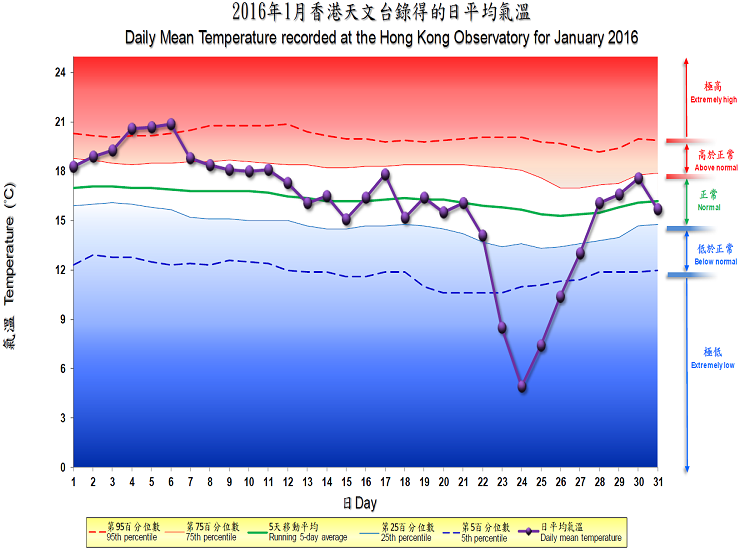
| Remarks : | Extremely high: above 95th percentile Above normal: between 75th and 95th percentile Normal: between 25th and 75th percentile Below normal: between 5th and 25th percentile Extremely low: below 5th percentile Percentile and 5-day running average values are computed based on the data from 1981 to 2010 |