The Weather of August 2015
2 September 2015
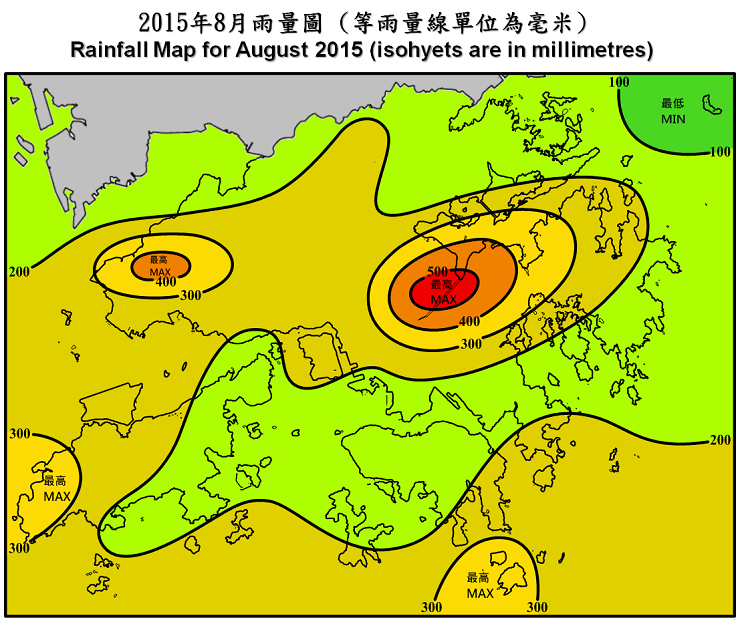
August 2015 was hotter and drier than usual. The mean temperature in the month was 29.3 degrees, 0.7 degree above the normal figure of 28.6 degrees and the seventh highest for August on record. The monthly total rainfall recorded in August 2015 was 143.3 millimetres, only about one-third of the normal figure of 432.2 millimetres. The accumulated rainfall of 1531.2 millimetres since 1 January was about 20 percent below the normal figure of 1905.5 millimetres for the same period.
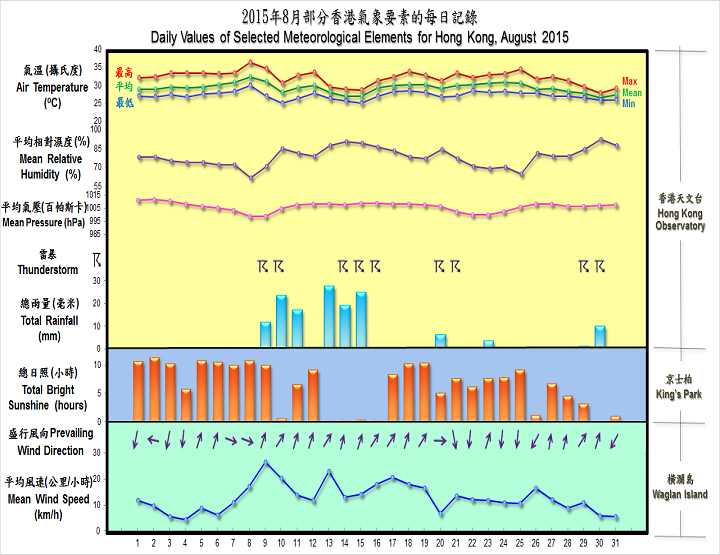
With a ridge of high pressure strengthening and extending westward from the western North Pacific to southern China, August 2015 started with a spell of fine weather. With plenty of sunshine, conditions became very hot during the day with maximum temperatures exceeding 33 degrees on 3 - 7 August. As Severe Typhoon Soudelor moved across Taiwan and made landfall over Fujian, the summer heat grew even more intense on 8 - 9 August under the subsidence effect ahead of Soudelor. With northwesterly winds bringing haze and a relatively dry air mass to Hong Kong, temperatures at the Observatory soared to a maximum of 36.3 degrees on the afternoon of 8 August, an all-time high since records began in 1884.
While it remained mostly fine and very hot during the day on 9 August, local weather also became more unsettled that night under the influence of a southwesterly airstream, with squally thunderstorms and showers bringing more than 30 millimetres of rain to many places of the territory, especially over the New Territories. Apart from a generally fine and very hot day on 12 August, showers and thunderstorms continued to affect Hong Kong on 10 - 16 August. Red rainstorm warning was issued on 15 August with more than 100 millimetres of rain recorded over the New Territories.
The weather in Hong Kong turned fine on 17 August and it was mostly a mixture of sunshine and showers with some very hot days in the week that followed. With another typhoon Goni east of Taiwan tracking towards Japan and bringing enhanced subsidence effect and off-land flow over the south China coastal areas, daytime temperatures in Hong Kong again reached 33 degrees and higher on 24 and 25 August.
With a trough of low pressure developing and lingering over the coast of Guangdong, the weather turned cloudier and more showery towards the end of the month.
Four tropical cyclones occurred over the South China Sea and the western North Pacific in the month.
Details of issuance and cancellation of various warnings/signals in the month are summarized in Tables 1.1 to 1.4. Monthly meteorological figures and departures from normal for August are tabulated in Table 2.
Warnings and Signals issued in August 2015
| Colour | Beginning Time | Ending Time | ||
|---|---|---|---|---|
| Day/Month | HKT | Day/Month | HKT | |
| Amber | 9 / 8 | 1930 | 9 / 8 | 2130 |
| Amber | 15 / 8 | 0645 | 15 / 8 | 0800 |
| Red | 15 / 8 | 0800 | 15 / 8 | 1025 |
| Amber | 15 / 8 | 1025 | 15 / 8 | 1100 |
| Beginning Time | Ending Time | ||
|---|---|---|---|
| Day/Month | HKT | Day/Month | HKT |
| 9 / 8 | 1840 | 9 / 8 | 2230 |
| 9 / 8 | 2320 | 10 / 8 | 0430 |
| 10 / 8 | 1250 | 10 / 8 | 1510 |
| 10 / 8 | 2245 | 11 / 8 | 0530 |
| 11 / 8 | 1435 | 11 / 8 | 1600 |
| 12 / 8 | 1120 | 12 / 8 | 1400 |
| 13 / 8 | 0600 | 13 / 8 | 1230 |
| 13 / 8 | 1555 | 13 / 8 | 1820 |
| 13 / 8 | 2350 | 14 / 8 | 1430 |
| 14 / 8 | 1650 | 14 / 8 | 1930 |
| 15 / 8 | 0415 | 15 / 8 | 1355 |
| 15 / 8 | 1700 | 15 / 8 | 1830 |
| 16 / 8 | 1230 | 16 / 8 | 1430 |
| 16 / 8 | 1600 | 16 / 8 | 1700 |
| 20 / 8 | 0945 | 20 / 8 | 1300 |
| 21 / 8 | 1735 | 21 / 8 | 1945 |
| 26 / 8 | 1230 | 26 / 8 | 1430 |
| 27 / 8 | 1405 | 27 / 8 | 1515 |
| 29 / 8 | 0240 | 29 / 8 | 0630 |
| 29 / 8 | 1120 | 29 / 8 | 1415 |
| 30 / 8 | 0720 | 30 / 8 | 0930 |
| 31 / 8 | 1230 | 31 / 8 | 1430 |
| Beginning Time | Ending Time | ||
|---|---|---|---|
| Day/Month | HKT | Day/Month | HKT |
| 1 / 8 | 0745 | 2 / 8 | 1845 |
| 3 / 8 | 0745 | 3 / 8 | 1915 |
| 4 / 8 | 0645 | 4 / 8 | 1845 |
| 5 / 8 | 0645 | 5 / 8 | 1815 |
| 6 / 8 | 0645 | 9 / 8 | 1845 |
| 12 / 8 | 1345 | 12 / 8 | 1800 |
| 17 / 8 | 1230 | 19 / 8 | 1830 |
| 21 / 8 | 1205 | 21 / 8 | 1945 |
| 22 / 8 | 0645 | 25 / 8 | 1845 |
| Beginning Time | Ending Time | ||
|---|---|---|---|
| Day/Month | HKT | Day/Month | HKT |
| 9 / 8 | 2005 | 9 / 8 | 2230 |
| 15 / 8 | 0900 | 15 / 8 | 1330 |
| Meteorological Element | Figure of the Month | Departure from Normal* |
|---|---|---|
| Mean Daily Maximum Air Temperature | 32.1 degrees C | 1.0 degree above normal |
| Mean Air Temperature | 29.3 degrees C | 0.7 degree above normal |
| Mean Daily Minimum Air Temperature | 27.2 degrees C | 0.6 degree above normal |
| Mean Dew Point Temperature | 25.0 degrees C | normal |
| Mean Relative Humidity | 78 % | 3 % below normal |
| Mean Cloud Amount | 65 % | 4 % below normal |
| Total Rainfall | 143.3 mm | 288.9 mm below normal |
| Number of hours of Reduced VisibilityΔ | 14 hours | 38.6 hours below normal§ |
| Total Bright Sunshine Duration | 195.9 hours | 7.0 hours above normal |
| Mean Daily Global Solar Radiation | 17.18 Megajoule / square metre | 1.55 Megajoule above normal |
| Total Evaporation | 150.2& mm | 15.3 mm above normal |
| Remarks : | All measurements were made at the Hong Kong Observatory except sunshine,
solar radiation and evaporation which were recorded at King's Park
Meteorological Station and visibility which was observed at the Hong
Kong International Airport. |
| Δ | The visibility readings at the Hong Kong International Airport are based on hourly observations by professional meteorological observers in 2004 and before, and average readings over the 10-minute period before the clock hour of the visibility meter near the middle of the south runway from 2005 onwards. The change of the data source in 2005 is an improvement of the visibility assessment using instrumented observations following the international trend.
|
* Departure from 1981 - 2010 climatological normal, except for number of hours of reduced visibility |
|
§ Departure from mean value between 1997 and 2014 |
|
& Data incomplete |
|
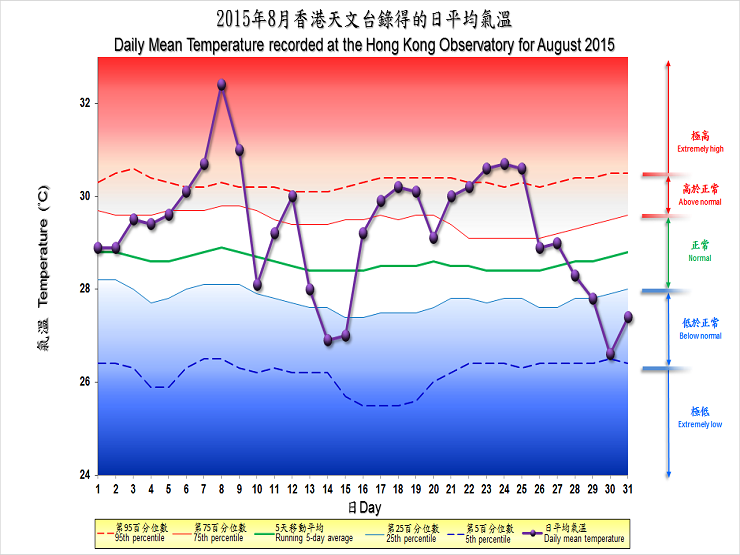
| Remarks : | Extremely high: above 95th percentile Above normal: between 75th and 95th percentile Normal: between 25th and 75th percentile Below normal: between 5th and 25th percentile Extremely low: below 5th percentile Percentile and 5-day running average values are computed based on the data from 1981 to 2010 |