The Weather of May 2015
2 June 2015
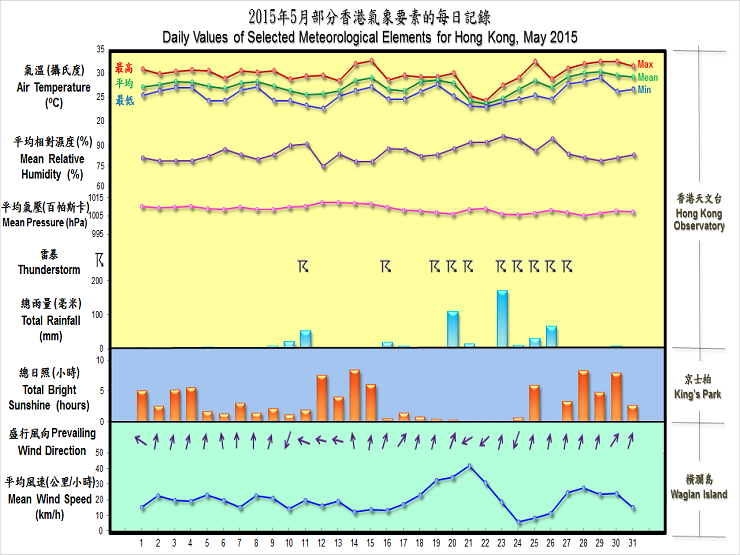
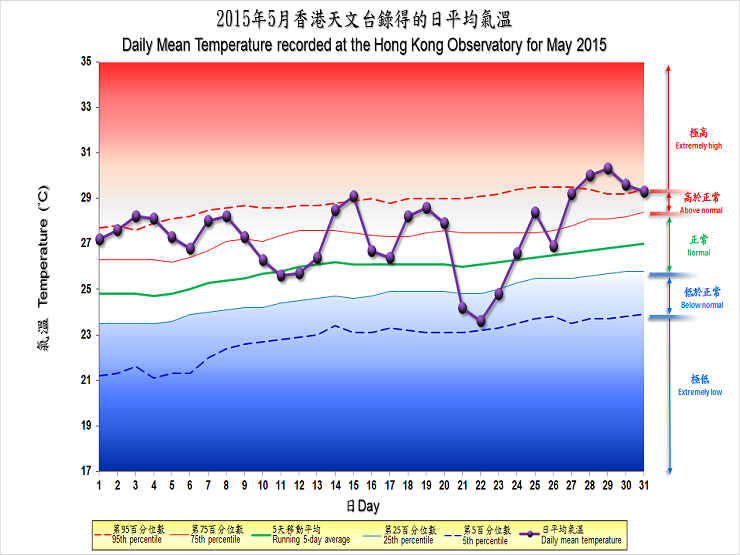
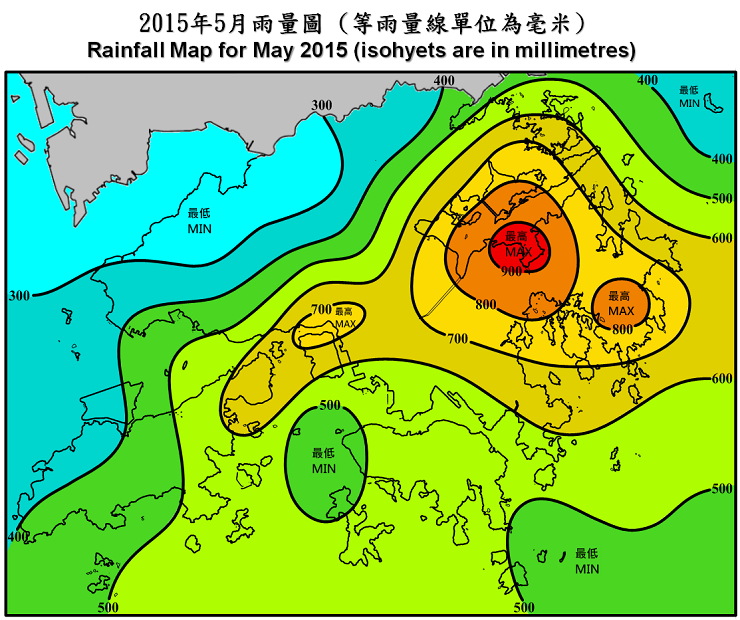
May 2015 was the fourth hottest May since records began in 1884. Its monthly mean temperature of 27.5 degrees was 1.6 degrees higher than the normal figure of 25.9 degrees. Affected by active troughs of low pressure in the second half of the month, May 2015 was actually cloudier than usual and rather rainy as well. Bright sunshine during the month amounted to 93.5 hours only, about 33 percent below the normal figure of 140.4 hours, the seventh lowest for May on record. The monthly total rainfall was 513.0 millimetres, a surplus of 68 percent against the normal figure of 304.7 millimetres. The accumulated rainfall of 679.6 millimetres since 1 January was about 6 percent above the normal figure of 640.8 millimetres for the same period.
Under the influence of a southerly airstream, the weather in Hong Kong was hot with sunny periods on the first four days of the month. A trough of low pressure brought generally cloudy weather with a few showers to the territory on 5-7 May. After a cloudy but relatively rain-free day on 8 May, another trough of low pressure brought heavier showers and thunderstorms to Hong Kong on 9-10 May.
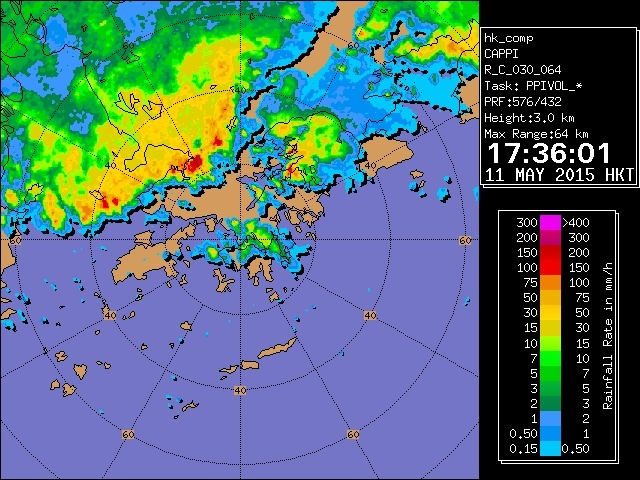
A cold front over southern China moved across the coast of Guangdong on 11 May. A squall line associated with the cold front brought heavy showers and squally thunderstorms to the territory later that day. A maximum gust of over 100 kilometres per hour was recorded at Lau Fau Shan during the passage of the squall line. Affected by a continental airstream, local weather became relatively cool and dry the next day. Temperature at the Observatory fell to 22.6 degrees on 12 May, the lowest of the month. As winds veered to southerly gradually, the weather became mainly fine and hot on 14-15 May. Temperature at the Observatory rose to 32.6 degrees on 15 May, the highest of the month.
With a trough of low pressure lingering over the coastal areas of Guangdong, local weather remained unsettled with occasional heavy showers and squally thunderstorms over the next twelve days. Two 'Red' rainstorm episodes on 20 and 23 May brought more than 150 millimetres of rain to most parts of the territory. Flooding was reported in Sha Tin, Ma On Shan and Tuen Mun on 20 May, and also at the low-lying areas in Sheung Shui and Yuen Long on 23 May. Meanwhile, a fresh to strong easterly airstream also brought windy and cooler conditions to the territory on 21-22 May. Another rapidly developed rainstorm brought more than 70 millimetres of rain to the urban areas and more than 100 millimetres to Sha Tin, Tsuen Wan, Sai Kung and Ma On Shan on 26 May, necessitating the first issuance of Black Rainstorm Warning of the year. Flooding was reported in Ho Man Tin, Sha Tin and Sai Kung.
With the weakening of the trough, the weather improved gradually with sunny periods on 28-30 May. However, the weather turned cloudy again with isolated showers and thunderstorms on 31 May as another trough of low pressure from southern China moved towards the coastal areas.
|
Two tropical cyclones occurred over the South China Sea and the western North Pacific in the month. |
|
Details of issuance and cancellation of various warnings/signals in the month are summarized in Tables 1.1 to 1.6. Monthly meteorological figures and departures from normal for May are tabulated in Table 2. |
Warnings and Signals issued in May 2015
| Beginning Time | Ending Time | ||
|---|---|---|---|
| Day/Month | HKT | Day/Month | HKT |
| 21 / 5 | 1135 | 22 / 5 | 0545 |
| Colour | Beginning Time | Ending Time | ||
|---|---|---|---|---|
| Day/Month | HKT | Day/Month | HKT | |
| Amber | 11 / 5 | 1725 | 11 / 5 | 1935 |
| Amber | 20 / 5 | 1645 | 20 / 5 | 1730 |
| Red | 20 / 5 | 1730 | 20 / 5 | 1940 |
| Amber | 20 / 5 | 1940 | 21 / 5 | 0300 |
| Amber | 23 / 5 | 0330 | 23 / 5 | 0720 |
| Amber | 23 / 5 | 1010 | 23 / 5 | 1105 |
| Amber | 23 / 5 | 1440 | 23 / 5 | 1605 |
| Red | 23 / 5 | 1605 | 23 / 5 | 1830 |
| Amber | 23 / 5 | 1830 | 23 / 5 | 1920 |
| Amber | 24 / 5 | 1630 | 24 / 5 | 1740 |
| Amber | 26 / 5 | 0940 | 26 / 5 | 1000 |
| Red | 26 / 5 | 1000 | 26 / 5 | 1025 |
| Black | 26 / 5 | 1025 | 26 / 5 | 1130 |
| Amber | 26 / 5 | 1130 | 26 / 5 | 1230 |
| Beginning Time | Ending Time | ||
|---|---|---|---|
| Day/Month | HKT | Day/Month | HKT |
| 20 / 5 | 2145 | 21 / 5 | 0630 |
| Beginning Time | Ending Time | ||
|---|---|---|---|
| Day/Month | HKT | Day/Month | HKT |
| 9 / 5 | 1408 | 9 / 5 | 2015 |
| 10 / 5 | 0935 | 10 / 5 | 1100 |
| 10 / 5 | 1900 | 11 / 5 | 0455 |
| 11 / 5 | 1040 | 11 / 5 | 2245 |
| 16 / 5 | 0530 | 16 / 5 | 1030 |
| 16 / 5 | 1205 | 16 / 5 | 1300 |
| 16 / 5 | 1355 | 16 / 5 | 1800 |
| 16 / 5 | 2120 | 16 / 5 | 2230 |
| 17 / 5 | 0900 | 17 / 5 | 1030 |
| 17 / 5 | 1320 | 17 / 5 | 1605 |
| 19 / 5 | 0825 | 19 / 5 | 1730 |
| 20 / 5 | 0116 | 20 / 5 | 0215 |
| 20 / 5 | 0500 | 20 / 5 | 0630 |
| 20 / 5 | 1100 | 21 / 5 | 0300 |
| 22 / 5 | 2135 | 23 / 5 | 2130 |
| 24 / 5 | 0130 | 24 / 5 | 0350 |
| 24 / 5 | 1550 | 24 / 5 | 1830 |
| 25 / 5 | 1935 | 25 / 5 | 2400 |
| 26 / 5 | 0755 | 26 / 5 | 1430 |
| 26 / 5 | 1525 | 26 / 5 | 1630 |
| 26 / 5 | 1650 | 26 / 5 | 1830 |
| 27 / 5 | 0530 | 27 / 5 | 1230 |
| 28 / 5 | 1430 | 28 / 5 | 1530 |
| 30 / 5 | 1835 | 30 / 5 | 2200 |
| 31 / 5 | 0530 | 31 / 5 | 1100 |
| 31 / 5 | 1745 | 31 / 5 | 1845 |
| 31 / 5 | 2010 | 31 / 5 | 2130 |
| Beginning Time | Ending Time | ||
|---|---|---|---|
| Day/Month | HKT | Day/Month | HKT |
| 28 / 5 | 1115 | 29 / 5 | 1945 |
| 30 / 5 | 1345 | 30 / 5 | 1715 |
| Beginning Time | Ending Time | ||
|---|---|---|---|
| Day/Month | HKT | Day/Month | HKT |
| 23 / 5 | 1540 | 23 / 5 | 1830 |
| Meteorological Element | Figure of the Month | Departure from Normal* |
|---|---|---|
| Mean Daily Maximum Air Temperature | 29.9 degrees C | 1.5 degrees above normal |
| Mean Air Temperature | 27.5 degrees C | 1.6 degrees above normal |
| Mean Daily Minimum Air Temperature | 25.5 degrees C | 1.4 degrees above normal |
| Mean Dew Point Temperature | 24.5 degrees C | 1.9 degrees above normal |
| Mean Relative Humidity | 85 % | 2 % above normal |
| Mean Cloud Amount | 84 % | 8 % above normal |
| Total Rainfall | 513.0 mm | 208.3 mm above normal |
| Number of hours of Reduced VisibilityΔ | 2 hours | 47.8 hours below normal§ |
| Total Bright Sunshine Duration | 93.5 hours | 46.9 hours below normal |
| Mean Daily Global Solar Radiation | 12.41 Megajoule / square metre | 1.78 Megajoule below normal |
| Total Evaporation | 98.2& mm | 12.5 mm below normal |
| Remarks : | All measurements were made at the Hong Kong Observatory except sunshine, solar radiation and evaporation which were recorded at King's Park Meteorological Station and visibility which was observed at the Hong Kong International Airport. |
| Δ |
The visibility readings at the Hong Kong International Airport are based on hourly observations by professional meteorological observers in 2004 and before, and average readings over the 10-minute period before the clock hour of the visibility meter near the middle of the south runway from 2005 onwards. The change of the data source in 2005 is an improvement of the visibility assessment using instrumented observations following the international trend. |
* Departure from 1981 - 2010 climatological normal, except for number of hours of reduced visibility |
|
§ Departure from mean value between 1997 and 2014 |
|
& Data incomplete |
|
| Remarks : | Extremely high: above 95th percentile Above normal: between 75th and 95th percentile Normal: between 25th and 75th percentile Below normal: between 5th and 25th percentile Extremely low: below 5th percentile Percentile and 5-day running average values are computed based on the data from 1981 to 2010 |
Extract of Meteorological Observations in Hong Kong for May 2015