The Weather of October 2014
|
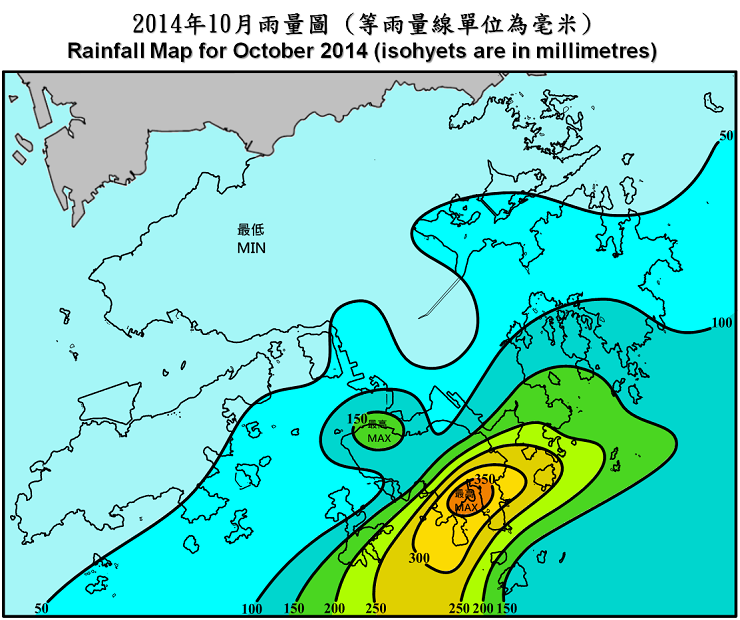
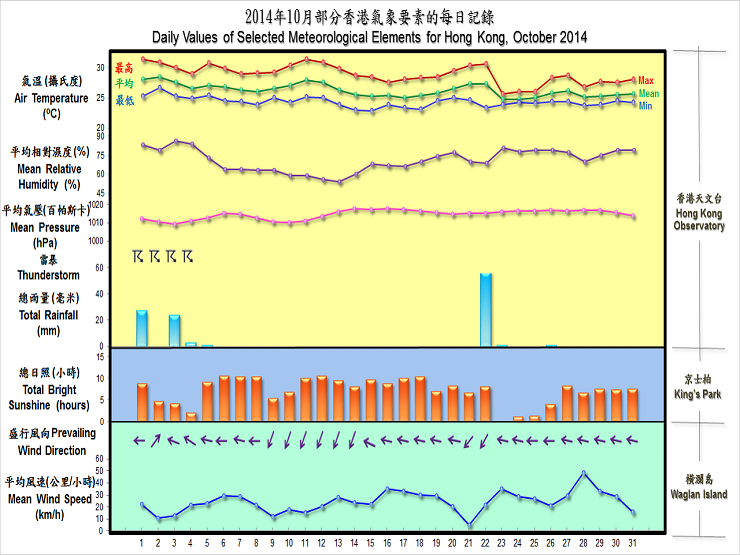
Under the dominance of a relatively dry northeast monsoon, October 2014 was much warmer and sunnier than usual. The mean temperature for the month was 26.2 degrees, 0.7 degrees above the normal figure of 25.5 degrees and also the one of the fifth highest for October since record began in 1884. The monthly total duration of sunshine was 222.9 hours, about 15 percent above the normal figure of 193.9 hours. With pulses of early-season northeast monsoon pushing towards the south China coast, local weather was unsettled with occasional heavy showers and squally thunderstorms on the first four days of the month, and a waterspout was spotted near Shek Pik on the morning of 3 October. The weather in Hong Kong turned fine on 5 October as a continental airstream reached southern China. With further replenishment of dry air mass brought by the northeast monsoon, the weather remained generally fine for more than a fortnight till 22 October. It became slightly cooler as well with nighttime temperatures falling to a minimum of 22.8 degrees on the morning of 15 October, the lowest of the month. While it was hot with sunny periods on 22 October, the arrival of a fresh to strong easterly airstream later that day coincided with the return of moist air to the coast of Guangdong. After some rainy episodes that night and early on 23 October, the weather remained generally cloudy in the next three days. |
|
Three tropical cyclones occurred over the South China Sea and the western North Pacific in the month. |
|
Details of issuance and cancellation of various warnings/signals in the month are summarized in Tables 1.1 to 1.4. Monthly meteorological figures and departures from normal for October are tabulated in Table 2. |
| Beginning Time | Ending Time | ||
|---|---|---|---|
| Day/Month | HKT | Day/Month | HKT |
| 27 / 10 | 2010 | 29 / 10 | 0920 |
| Colour | Beginning Time | Ending Time | ||
|---|---|---|---|---|
| Day/Month | HKT | Day/Month | HKT | |
| Amber | 1 / 10 | 0155 | 1 / 10 | 0330 |
| Amber | 3 / 10 | 2005 | 3 / 10 | 2145 |
| Beginning Time | Ending Time | ||
|---|---|---|---|
| Day/Month | HKT | Day/Month | HKT |
| 1 / 10 | 0030 | 1 / 10 | 0400 |
| 2 / 10 | 0015 | 2 / 10 | 0215 |
| 2 / 10 | 1615 | 2 / 10 | 1735 |
| 3 / 10 | 0650 | 3 / 10 | 0830 |
| 3 / 10 | 1120 | 3 / 10 | 1600 |
| 3 / 10 | 1835 | 3 / 10 | 2245 |
| 3 / 10 | 2330 | 4 / 10 | 1030 |
| Colour | Beginning Time | Ending Time | ||
|---|---|---|---|---|
| Day/Month | HKT | Day/Month | HKT | |
| Yellow | 2 / 10 | 0600 | 2 / 10 | 1945 |
| Yellow | 5 / 10 | 0630 | 5 / 10 | 2145 |
| Red | 6 / 10 | 0600 | 6 / 10 | 2245 |
| Red | 9 / 10 | 0600 | 9 / 10 | 1900 |
| Yellow | 11 / 10 | 0600 | 12 / 10 | 0600 |
| Red | 12 / 10 | 0600 | 13 / 10 | 2130 |
| Yellow | 18 / 10 | 0600 | 19 / 10 | 2315 |
| Yellow | 26 / 10 | 0600 | 26 / 10 | 2130 |
| Meteorological Element | Figure of the Month | Departure from Normal* |
|---|---|---|
| Mean Daily Maximum Air Temperature | 28.9 degrees C | 1.1 degrees above normal |
| Mean Air Temperature | 26.2 degrees C | 0.7 degree above normal |
| Mean Daily Minimum Air Temperature | 24.3 degrees C | 0.6 degree above normal |
| Mean Dew Point Temperature | 20.4 degrees C | 0.2 degree above normal |
| Mean Relative Humidity | 71 % | 2 % below normal |
| Mean Cloud Amount | 54 % | 4 % below normal |
| Total Rainfall | 109.8 mm | 8.9 mm above normal |
| Number of hours of Reduced VisibilityΔ | 81 hours | 72.3 hours below normal§ |
| Total Bright Sunshine Duration | 222.9 hours | 29.0 hours above normal |
| Mean Daily Global Solar Radiation | 16.30 Megajoule / square metre | 2.25 Megajoule above normal |
| Total Evaporation | 146.4 mm | 22.5 mm above normal |
| Remarks : | All measurements were made at the Hong Kong Observatory except sunshine, solar radiation and evaporation which were recorded at King's Park Meteorological Station and visibility which was observed at the Hong Kong International Airport. |
| Δ |
The visibility readings at the Hong Kong International Airport are based on hourly observations by professional meteorological observers in 2004 and before, and average readings over the 10-minute period before the clock hour of the visibility meter near the middle of the south runway from 2005 onwards. The change of the data source in 2005 is an improvement of the visibility assessment using instrumented observations following the international trend. |
* Departure from 1981 - 2010 climatological normal, except for number of hours of reduced visibility |
|
§ Departure from mean value between 1997 and 2013 |
|
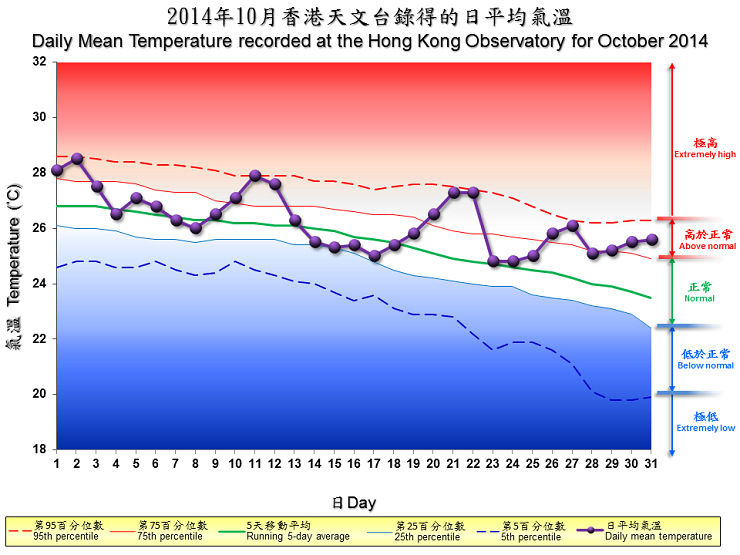
| Remarks : | Extremely high: above 95th percentile Above normal: between 75th and 95th percentile Normal: between 25th and 75th percentile Below normal: between 5th and 25th percentile Extremely low: below 5th percentile Percentile and 5-day running average values are computed based on the data from 1981 to 2010 |