The Weather of July 2014
|
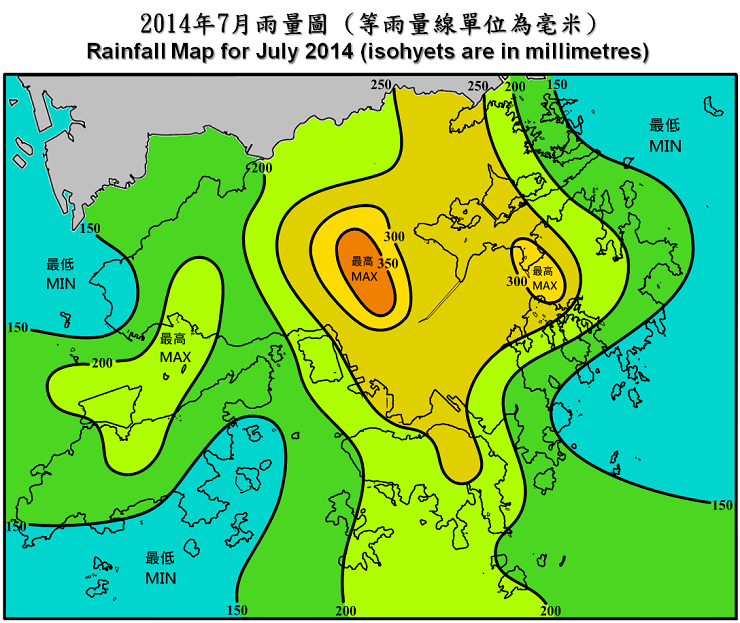
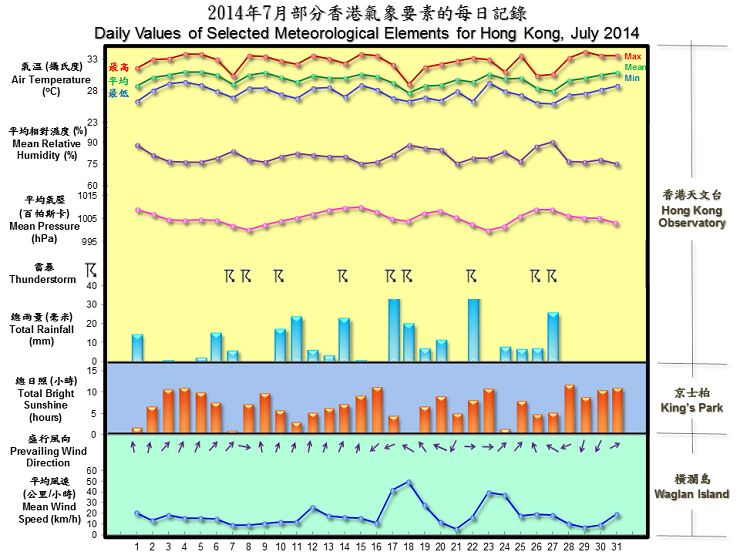
Under the dominance of a subtropical ridge over southern China for most part of the month, and with episodes of continental air flow brought by passages of tropical cyclones over the East China Sea, July 2014 emerged as the hottest July in Hong Kong with a record-breaking monthly mean temperature of 29.8 degrees. The monthly mean minimum temperature of 27.6 degrees equalled the July record, while the monthly mean maximum temperature of 32.6 degrees also ranked as one of the second highest for July. The month was relatively sunny and drier than usual with a monthly rainfall amount of 260.5 millimetres, about 31 percent below the July normal of 376.5 millimetres. The accumulated rainfall since 1 January was 1763.9 millimetres, about 20 percent above the normal of 1473.3 millimetres for the same period. The weather started off with mainly cloudy weather and isolated thundery showers in Hong Kong. As a moderate southwest monsoon prevailed over the south China coast, the weather was a mixture of sunshine and showers up to 16 July. On days with more sunshine, daytime conditions became very hot with temperatures exceeding 33 degrees. The intense heat was most keenly felt during the passage of Super Typhoon Neoguri over the East China Sea on 8 and 9 July. There were also occasional days with cloudier and more showery weather, most noticeably on 7 and 11 July. Meanwhile, Severe Typhoon Rammasun swept past Luzon on 16 July and edged closer to the south China coast. Local winds strengthened gradually and the weather became cloudy with showers and squally thunderstorms the next day. Rammasun further developed into a super typhoon on the morning of 18 July and made landfall near Wenchang over the northern part of Hainan Island. Local winds strengthened further with occasional heavy showers and squally thunderstorms that day. With Rammasun moving away and weakening gradually after crossing the coast of Guangxi, local winds subsided gradually and there were sunny periods with a few showers on 19 July. With the establishment of an anticyclone over southeastern China, it was sunny and hot apart from a few showers on 20 and 21 July. As Typhoon Matmo swept past Taiwan and moved into southeastern China over the next couple of days, Hong Kong was affected by a continental airstream that brought fine and very hot weather to the territory. The high temperatures also triggered some heavy showers and squally thunderstorms in the afternoon on 22 July. The southwest monsoon was enhanced in the wake of Typhoon Matmo on 23 and 24 July, while local weather was a mix of sunny periods and thundery showers up to 27 July, with a funnel cloud observed over the waters west of Tuen Mun in the morning on 25 July. A ridge of high pressure then extended over southern China and maintained generally fine and very hot weather in Hong Kong, with temperatures at the Hong Kong Observatory rising to a maximum of 34.2 degrees on 29 July, the highest of the month. With Tropical Storm Nakri passing to the east of Taiwan, very hot conditions were maintained in Hong Kong till the end of the month. |
|
 The funnel cloud observed from the Airport Meteorological Office on the morning of 25 July 2014
Five tropical cyclones occurred over the South China Sea and the western North Pacific in the month. Details of issuance and cancellation of various warnings/signals in the month are summarized in Tables 1.1 to 1.4. Monthly meteorological figures and departures from normal for July are tabulated in Table 2. |
Warnings and Signals issued in July 2014
| Name of Tropical Cyclone |
Signal Number |
Beginning Time | Ending Time | ||
|---|---|---|---|---|---|
| Day/Month | HKT | Day/Month | HKT | ||
| RAMMASUN | 1 | 16 / 7 | 2340 | 17 / 7 | 1615 |
| 3 | 17 / 7 | 1615 | 18 / 7 | 1940 | |
| 1 | 18 / 7 | 1940 | 19 / 7 | 0340 | |
| Colour | Beginning Time | Ending Time | ||
|---|---|---|---|---|
| Day/Month | HKT | Day/Month | HKT | |
| Amber | 22 / 7 | 1550 | 22 / 7 | 1700 |
| Amber | 24 / 7 | 2215 | 24 / 7 | 2315 |
| Beginning Time | Ending Time | ||
|---|---|---|---|
| Day/Month | HKT | Day/Month | HKT |
| 1 / 7 | 0540 | 1 / 7 | 0930 |
| 1 / 7 | 1525 | 1 / 7 | 2000 |
| 1 / 7 | 2110 | 1 / 7 | 2215 |
| 2 / 7 | 0630 | 2 / 7 | 0730 |
| 5 / 7 | 1055 | 5 / 7 | 1200 |
| 5 / 7 | 1715 | 5 / 7 | 1815 |
| 6 / 7 | 0700 | 6 / 7 | 1100 |
| 7 / 7 | 0400 | 7 / 7 | 0830 |
| 7 / 7 | 1100 | 7 / 7 | 1500 |
| 8 / 7 | 1130 | 8 / 7 | 1500 |
| 8 / 7 | 1650 | 8 / 7 | 1800 |
| 9 / 7 | 1235 | 9 / 7 | 1430 |
| 10 / 7 | 0020 | 10 / 7 | 0155 |
| 10 / 7 | 0730 | 10 / 7 | 1200 |
| 10 / 7 | 1420 | 10 / 7 | 1530 |
| 11 / 7 | 0215 | 11 / 7 | 0300 |
| 11 / 7 | 0425 | 11 / 7 | 0730 |
| 11 / 7 | 1000 | 11 / 7 | 1100 |
| 11 / 7 | 1110 | 11 / 7 | 1215 |
| 11 / 7 | 1400 | 11 / 7 | 1500 |
| 12 / 7 | 0600 | 12 / 7 | 1100 |
| 12 / 7 | 1400 | 12 / 7 | 1930 |
| 12 / 7 | 2040 | 12 / 7 | 2245 |
| 13 / 7 | 0850 | 13 / 7 | 1630 |
| 14 / 7 | 0615 | 14 / 7 | 0845 |
| 14 / 7 | 1000 | 14 / 7 | 1130 |
| 14 / 7 | 1240 | 14 / 7 | 1345 |
| 15 / 7 | 0500 | 15 / 7 | 0600 |
| 17 / 7 | 0720 | 17 / 7 | 0900 |
| 17 / 7 | 1130 | 17 / 7 | 2230 |
| 17 / 7 | 2330 | 18 / 7 | 0130 |
| 18 / 7 | 0525 | 18 / 7 | 0630 |
| 18 / 7 | 0920 | 18 / 7 | 1730 |
| 19 / 7 | 0830 | 19 / 7 | 1030 |
| 19 / 7 | 2305 | 20 / 7 | 0015 |
| 20 / 7 | 0235 | 20 / 7 | 0700 |
| 21 / 7 | 1445 | 21 / 7 | 1545 |
| 22 / 7 | 1355 | 22 / 7 | 1715 |
| 23 / 7 | 0635 | 23 / 7 | 0745 |
| 24 / 7 | 0725 | 24 / 7 | 0930 |
| 24 / 7 | 2145 | 25 / 7 | 0030 |
| 25 / 7 | 1025 | 25 / 7 | 1230 |
| 26 / 7 | 0715 | 26 / 7 | 1315 |
| 26 / 7 | 2225 | 27 / 7 | 0015 |
| 27 / 7 | 0200 | 27 / 7 | 0900 |
| 27 / 7 | 1050 | 27 / 7 | 1430 |
| Beginning Time | Ending Time | ||
|---|---|---|---|
| Day/Month | HKT | Day/Month | HKT |
| 2 / 7 | 1135 | 2 / 7 | 1830 |
| 3 / 7 | 0645 | 7 / 7 | 1130 |
| 8 / 7 | 1025 | 10 / 7 | 1830 |
| 12 / 7 | 1350 | 16 / 7 | 1930 |
| 22 / 7 | 0645 | 23 / 7 | 2300 |
| 25 / 7 | 1350 | 25 / 7 | 1800 |
| 28 / 7 | 1145 | 1 / 8 | 2015 |
| Meteorological Element | Figure of the Month | Departure from Normal* |
|---|---|---|
| Mean Daily Maximum Air Temperature | 32.6 degrees C | 1.2 degrees above normal |
| Mean Air Temperature | 29.8 degrees C | 1.0 degree above normal |
| Mean Daily Minimum Air Temperature | 27.6 degrees C | 0.8 degree above normal |
| Mean Dew Point Temperature | 25.9 degrees C | 0.8 degree above normal |
| Mean Relative Humidity | 80 % | 1 % below normal |
| Mean Cloud Amount | 70 % | 1 % above normal |
| Total Rainfall | 260.5 mm | 116.0 mm below normal |
| Number of hours of Reduced VisibilityΔ | 14 hours | 1.9 hours below normal§ |
| Total Bright Sunshine Duration | 217.5 hours | 5.5 hours above normal |
| Mean Daily Global Solar Radiation | 19.31 Megajoule / square metre | 2.14 Megajoule above normal |
| Total Evaporation | 159.8^ mm | 13.6 mm above normal |
| Remarks : | All measurements were made at the Hong Kong Observatory except sunshine, solar radiation and evaporation which were recorded at King's Park Meteorological Station and visibility which was observed at the Hong Kong International Airport. |
| Δ |
Before 10 October 2007, the number of hours of reduced visibility at the Hong Kong International Airport in 2005 and thereafter displayed in this web page was based on hourly visibility observations by professional meteorological observers. Since 10 October 2007, the data have been revised using the average visibility readings over the 10-minute period before the clock hour, as recorded by the visibility meter near the middle of the south runway. |
* Departure from 1981 - 2010 climatological normal, except for number of hours of reduced visibility |
|
§ Departure from mean value between 1997 and 2013 |
|
^ Total for 30 days |
|
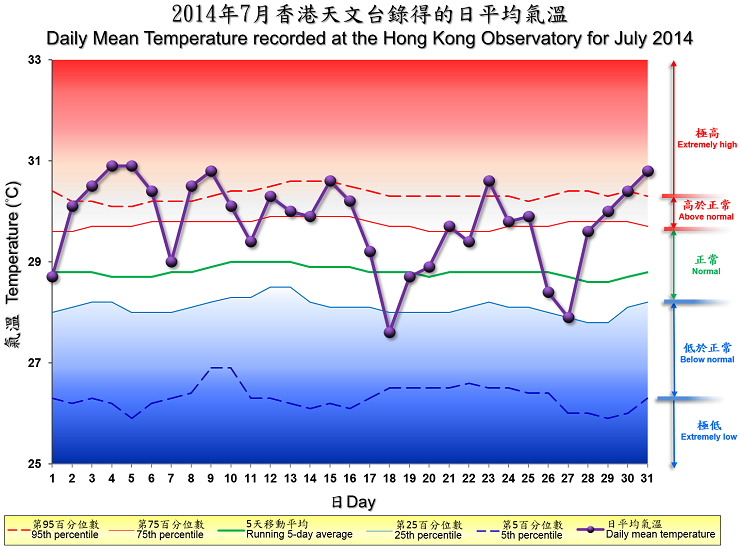
| Remarks : | Extremely high: above 95th percentile Above normal: between 75th and 95th percentile Normal: between 25th and 75th percentile Below normal: between 5th and 25th percentile Extremely low: below 5th percentile Percentile and 5-day running average values are computed based on the data from 1981 to 2010 |