The Weather of January 2012
|
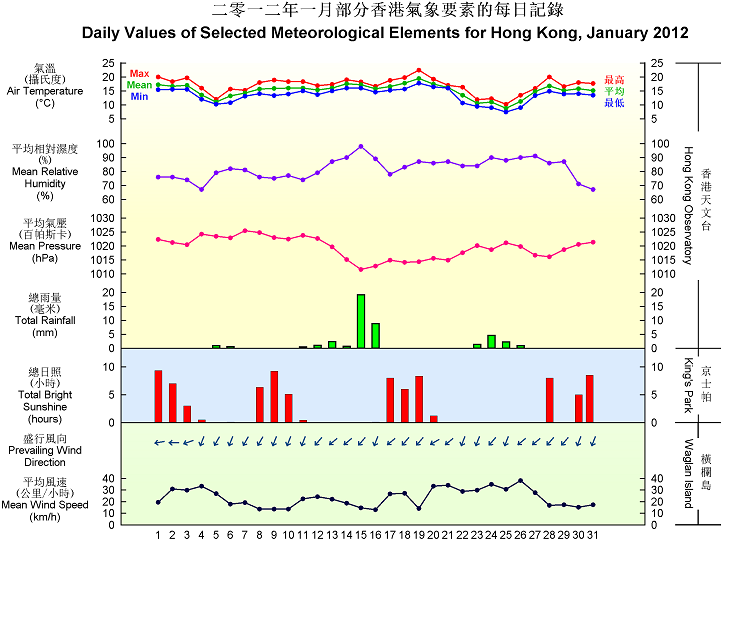
Under the dominance of the winter monsoon, January 2012 was colder than usual. The mean temperature of the month was 15.1 degrees, 1.2 degrees below the normal figure of 16.3 degrees. The month was also wetter and gloomier than usual. The monthly rainfall of 42.1 millimetres was 17.4 millimetres above normal. The monthly total duration of bright sunshine was 86.0 hours, a deficit of 40 percent against to the normal figure of 143.0 hours. |
|
There was no tropical cyclone over the South China Sea and the western North Pacific in the month. |
|
Details of issuance and cancellation of various warnings/signals in the month are summarized in Tables 1.1 to 1.3. Monthly meteorological figures and departures from normal for January are tabulated in Table 2. |
Warnings and Signals issued in January 2012
| Beginning Time | Ending Time | ||
|---|---|---|---|
| Day/Month | HKT | Day/Month | HKT |
| 25 / 1 | 0445 | 25 / 1 | 0745 |
| Colour | Beginning Time | Ending Time | ||
|---|---|---|---|---|
| Day/Month | HKT | Day/Month | HKT | |
| Yellow | 1 / 1 | 0600 | 2 / 1 | 1800 |
| Yellow | 8 / 1 | 0600 | 8 / 1 | 2200 |
| Red | 31 / 1 | 0600 | 31 / 1 | 1930 |
| Beginning Time | Ending Time | ||
|---|---|---|---|
| Day/Month | HKT | Day/Month | HKT |
| 3 / 1 | 1620 | 7 / 1 | 1100 |
| 21 / 1 | 1620 | 27 / 1 | 1200 |
| 30 / 1 | 1620 | 31 / 1 | 0845 |
| Meteorological Element | Figure of the Month | Departure from Normal* |
|---|---|---|
| Mean Daily Maximum Air Temperature | 17.0 degrees C | 1.6 degrees below normal |
| Mean Air Temperature | 15.1 degrees C | 1.2 degrees below normal |
| Mean Daily Minimum Air Temperature | 13.5 degrees C | 1.0 degree below normal |
| Mean Dew Point Temperature | 11.9 degrees C | 0.5 degree above normal |
| Mean Relative Humidity | 82 % | 8 % above normal |
| Mean Cloud Amount | 79 % | 18 % above normal |
| Total Rainfall | 42.1 mm | 17.4 mm above normal |
| Number of hours of Reduced VisibilityΔ | 223 hours | 25.1 hours below normal§ |
| Total Bright Sunshine Duration | 86.0 hours | 57.0 hours below normal |
| Mean Daily Global Solar Radiation | 8.16 Megajoule / square metre | 2.01 Megajoule below normal |
| Total Evaporation | 54.8 mm | 16.5 mm below normal |
| Remarks : | All measurements were made at the Hong Kong Observatory except sunshine, solar radiation and evaporation which were recorded at King's Park Meteorological Station and visibility which was observed at the Hong Kong International Airport. |
| Δ |
The visibility readings at the Hong Kong International Airport are based on hourly observations by professional meteorological observers in 2004 and before, and average readings over the 10-minute period before the clock hour of the visibility meter near the middle of the south runway from 2005 onwards. The change of the data source in 2005 is an improvement of the visibility assessment using instrumented observations following the international trend. |
* Departure from 1981 - 2010 climatological normal, except for number of hours of reduced visibility |
|
§ Departure from mean value between 1997 and 2011 |
|
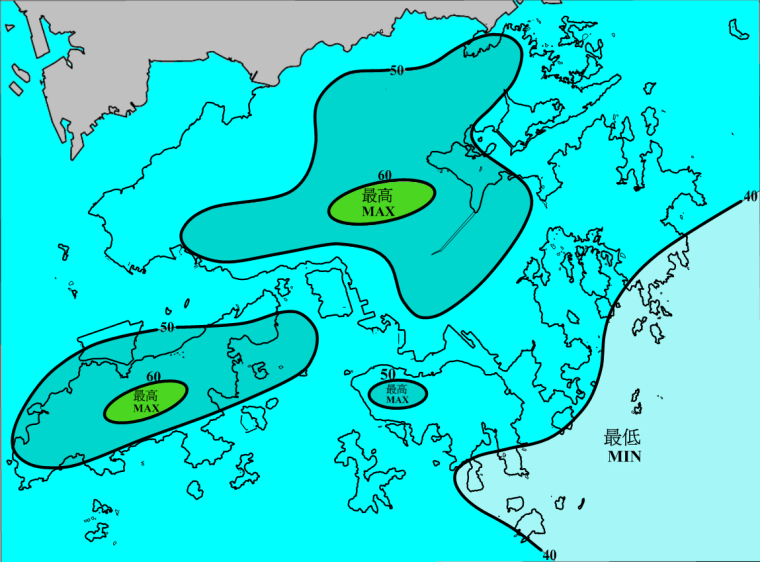
Rainfall Map For January 2012 (isohyets are in millimetres)
Extract of Meteorological Observations in Hong Kong for January 2012