Skip Content

The Weather of December 2010

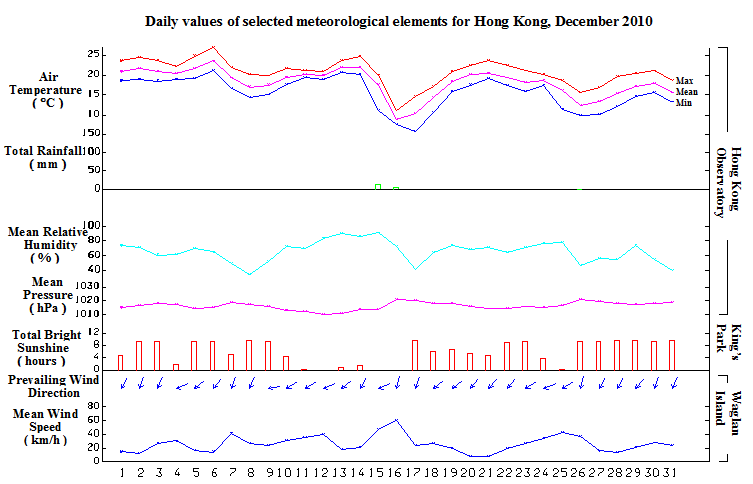
     Despite several cold episodes in the month, the mean temperature of December 2010 was 18.1 degrees, 0.3 degrees above normal.  It was mainly due to the high daytime temperatures in generally fine and dry weather brought by the dry winter monsoon.  While there were seven cold days (daily minimum temperature at 12.0 degrees or below) and five days with frost reported, there were 22 days with maximum temperatures shooting up to 20.0 degrees or higher in the month.  The lowest temperature recorded on 17 December was 5.8 degrees, the lowest for December since 1999; and the highest temperature recorded on 6 December was 26.8 degrees, the highest for December since 1968.

     The total rainfall in December 2010 was 18.4 millimetres, only about 53 percent of normal.  The annual rainfall for 2010 was 2371.7 millimetres, close to the normal figure of 2382.7 millimetres.

     A ridge of high pressure covering southern China brought generally fine and dry weather to Hong Kong for the first six days of the month.  With abundant sunshine, the mercury on 6 December rose to 26.8 degrees, the highest of the month.

     Following the passage of a cold front over south China coastal areas and arrival of the winter monsoon on 7 December morning, the weather became appreciably cooler and drier.  It remained cool and very dry on 8 and 9 December with a minimum relative humidity of about 20 percent.  With moderation of the winter monsoon, local temperatures started to rise on 10 December.  The weather turned cloudy on 11 December with light rain patches setting in on 12 December.  A humid easterly airstream brought mist and fog to Hong Kong in the following two days.  Locally, visibility in the harbour fell to below 1000 metres in fog in the morning of 14 December.

     In northern China, cold air associated with an intense winter monsoon spread southward across the country and reached Guangdong on 15 December.  Local temperatures fell sharply in rain during the overnight period from 15 to 16 December, bringing very cold weather to Hong Kong.  The minimum temperature on 17 December morning dropped to 5.8 degrees, the lowest of the year.  The dry continental airstream cleared the clouds and the weather became fine and dry on 17 December.  With moderation of the winter monsoon, temperatures began to rise on 18 December but inland temperature remained on the low side due to radiation cooling effect with the mercury at Ta Kwu Ling falling to 0.2 degrees, levelling the record low for December registered in 1999.
 
     A moderate northeast monsoon prevailed from 19 to 23 December, bringing mainly fine and dry weather with haze to Hong Kong.  Daytime temperatures rose to above 20 degrees during the period. 

     The weather turned cloudy with sunny intervals on 24 December and there remained to be some haze.  A cold front over southern China moved southward and crossed the coast on 25 December, bringing rain and cold weather to Hong Kong.  The mercury fell to 9.8 degrees on 26 December morning and the sky cleared up under the influence of the dry winter monsoon which maintained a fine and dry weather for the ensuring four days.  It remained cold with frost in the morning on 27 and 28 December while temperatures rose in general until 30 December.  The arrival of a replenishment of the winter monsoon brought cooler and very dry weather to Hong Kong on the last day of the month.

    One tropical cyclone occurred over the western North Pacific and the South China Sea in the month. 

     Details of issuance and cancellation of various warnings/signals in the month are summarized in Tables 1.1 to 1.4.  Monthly meteorological figures and departures from normal for December are tabulated in Table 2.

Warnings and Signals issued in December 2010


Table 1.1   Strong Monsoon Signal

Beginning Time Ending Time
Day/Month HKT Day/Month HKT
7 / 12 0945 7 / 12 1615
14 / 12 2200 17 / 12 0930
25 / 12 2350 26 / 12 1130


Table 1.2   Fire Danger Warnings

Colour Beginning Time Ending Time
Day/Month HKT Day/Month HKT
Red 3 / 12 0600 3 / 12 2330
Yellow 4 / 12 0600 4 / 12 1200
Red 4 / 12 1200 5 / 12 0600
Yellow 5 / 12 0600 5 / 12 2400
Red 6 / 12 1415 9 / 12 1800
Red 17 / 12 0345 18 / 12 1800
Yellow 18 / 12 1800 19 / 12 1800
Red 22 / 12 0615 22 / 12 2100
Red 26 / 12 0630 27 / 12 2345
Red 28 / 12 0630 1 / 1 2355


Table 1.3   Frost Warning

Beginning Time Ending Time
Day/Month HKT Day/Month HKT
16 / 12 1200 17 / 12 0830
17 / 12 1630 18 / 12 0915
25 / 12 2300 26 / 12 0745
26 / 12 1620 27 / 12 0930
27 / 12 1615 28 / 12 0745


Table 1.4   Cold Weather Warning

Beginning Time Ending Time
Day/Month HKT Day/Month HKT
15 / 12 1620 18 / 12 1000
25 / 12 1430 28 / 12 0930
30 / 12 1620 2 / 1 0745


Table 2   Figures and Departures from Normal - December 2010

Meteorological Element Figure of the Month Departure from Normal*
Mean Daily Maximum Air Temperature 20.8 degrees C 0.5 degree above normal
Mean Air Temperature 18.1 degrees C 0.3 degree above normal
Mean Daily Minimum Air Temperature 15.6 degrees C 0.1 degree below normal
Mean Dew Point Temperature 11.1 degrees C 0.5 degree below normal
Mean Relative Humidity 66 % 3 % below normal
Mean Cloud Amount 45 % 6 % below normal
Total Rainfall 18.4 mm 16.1 mm below normal
Number of hours of Reduced VisibilityΔ 172 hours 79.8 hours below normal§
Total Bright Sunshine Duration 185.8 hours 12.5 hours above normal
Mean Daily Global Solar Radiation 12.03 Megajoule / square metre 0.90 Megajoule above normal
Total Evaporation 95.3 mm 0.8 mm above normal


  Remarks : All measurements were made at the Hong Kong Observatory except sunshine, solar radiation and evaporation which were recorded at King's Park Meteorological Station and visibility which was observed at the Hong Kong International Airport.

  Δ

The visibility readings at the Hong Kong International Airport are based on hourly observations by professional meteorological observers in 2004 and before, and average readings over the 10-minute period before the clock hour of the visibility meter near the middle of the south runway from 2005 onwards. The change of the data source in 2005 is an improvement of the visibility assessment using instrumented observations following the international trend.
Before 10 October 2007, the number of hours of reduced visibility at the Hong Kong International Airport in 2005 and thereafter displayed in this web page was based on hourly visibility observations by professional meteorological observers. Since 10 October 2007, the data have been revised using the average visibility readings over the 10-minute period before the clock hour, as recorded by the visibility meter near the middle of the south runway.


  *   Departure from 1971 - 2000 climatological normal, except for number of hours of reduced visibility

  §   Departure from mean value between 1997 and 2009