The Weather of July 2008
|
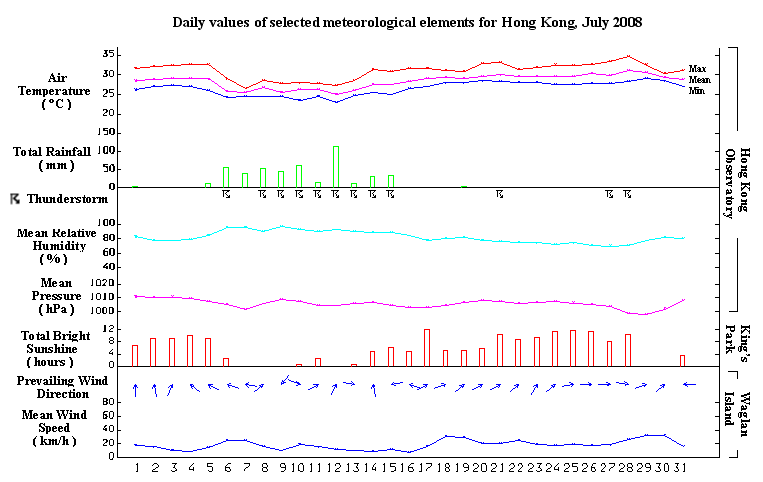
July 2008 was wetter than usual. The total rainfall in the month was 471.1 millimetres, 96.7 millimetres above normal. The accumulated rainfall since 1 January was 2382.1 millimetres, about 67 percent above the normal figure of 1429.1 millimetres for the same period. It was also the second highest for the same period since 1884. Under the influence of a ridge of high pressure, the weather in Hong Kong was mainly fine apart from a few isolated showers for the starting five days of the month. An area of low pressure over the northern part of the South China Sea followed by a trough of low pressure over the south China coastal areas brought rainy and thundery weather to the territory from 6 to 15 July. With the trough of low pressure weakening gradually, the rain eased off on 16 July and there were some sunny periods during the day. The weather was sunny and hot on 17 July. Under the influence of a southwesterly airstream over southern China, the weather became mainly cloudy with a few isolated showers from 18 to 20 July. A ridge of high pressure covered the south China coastal areas and brought sunny and hot weather to Hong Kong for the following six days. With Typhoon Fung-Wong over the western North Pacific moving towards Taiwan, the hot subsiding air ahead of Fung-Wong brought very hot weather to the territory on 27 and 28 July. The temperature at the Hong Kong Observatory on 28 July rose to 34.6 degrees, the highest of the month. Severe thunderstorms developed inland Guangdong moved south to affect the territory in the afternoon of 27 July as well as the evening of 28 July. Hails were reported at Sha Tau Kok, Fanling and Yuen Long, and squalls up to 131 kilometres per hour were recorded at Lau Fau Shan on 27 July during the passage of the thunderstorms. The rainbands associated with Fung-Wong brought a few showers to the territory on 29 and 30 July. There were some sunny intervals on the last day of the month. Two tropical cyclones occurred in the western North Pacific and the South China Sea in the month. |
|
Details of issuance and cancellation of various warnings/signals in the month are summarized in Tables 1.1 to 1.6. Monthly meteorological figures and departures from normal for July are tabulated in Table 2. |
Warnings and Signals issued in July 2008
| Beginning Time | Ending Time | ||
|---|---|---|---|
| Day/Month | HKT | Day/Month | HKT |
| 30 / 7 | 0145 | 30 / 7 | 1015 |
| Colour | Beginning Time | Ending Time | ||
|---|---|---|---|---|
| Day/Month | HKT | Day/Month | HKT | |
| Amber | 6 / 7 | 1735 | 6 / 7 | 1920 |
| Amber | 8 / 7 | 0915 | 8 / 7 | 1045 |
| Amber | 10 / 7 | 0635 | 10 / 7 | 1115 |
| Amber | 12 / 7 | 0215 | 12 / 7 | 0300 |
| Red | 12 / 7 | 0300 | 12 / 7 | 0710 |
| Amber | 12 / 7 | 0710 | 12 / 7 | 0745 |
| Amber | 14 / 7 | 2325 | 15 / 7 | 0130 |
| Beginning Time | Ending Time | ||
|---|---|---|---|
| Day/Month | HKT | Day/Month | HKT |
| 10 / 7 | 0905 | 10 / 7 | 1725 |
| Beginning Time | Ending Time | ||
|---|---|---|---|
| Day/Month | HKT | Day/Month | HKT |
| 1 / 7 | 0425 | 1 / 7 | 0500 |
| 5 / 7 | 1215 | 5 / 7 | 1415 |
| 5 / 7 | 1450 | 5 / 7 | 1600 |
| 6 / 7 | 0145 | 6 / 7 | 0600 |
| 6 / 7 | 0915 | 6 / 7 | 1430 |
| 6 / 7 | 1605 | 6 / 7 | 2000 |
| 7 / 7 | 0245 | 7 / 7 | 1030 |
| 7 / 7 | 1220 | 7 / 7 | 1330 |
| 7 / 7 | 2120 | 8 / 7 | 0030 |
| 8 / 7 | 0720 | 8 / 7 | 1145 |
| 8 / 7 | 1540 | 8 / 7 | 1645 |
| 8 / 7 | 1845 | 8 / 7 | 2000 |
| 8 / 7 | 2305 | 9 / 7 | 1430 |
| 9 / 7 | 1630 | 9 / 7 | 1900 |
| 9 / 7 | 2255 | 10 / 7 | 1200 |
| 10 / 7 | 1340 | 10 / 7 | 1500 |
| 11 / 7 | 0210 | 11 / 7 | 0900 |
| 11 / 7 | 2015 | 11 / 7 | 2215 |
| 11 / 7 | 2315 | 12 / 7 | 0730 |
| 13 / 7 | 0305 | 13 / 7 | 0700 |
| 13 / 7 | 1045 | 13 / 7 | 1445 |
| 14 / 7 | 1350 | 14 / 7 | 1500 |
| 14 / 7 | 1705 | 15 / 7 | 0730 |
| 15 / 7 | 1300 | 15 / 7 | 1615 |
| 16 / 7 | 1220 | 16 / 7 | 1430 |
| 19 / 7 | 0810 | 19 / 7 | 1100 |
| 19 / 7 | 1930 | 19 / 7 | 2030 |
| 20 / 7 | 1305 | 20 / 7 | 1415 |
| 21 / 7 | 0205 | 21 / 7 | 0430 |
| 27 / 7 | 1415 | 27 / 7 | 1800 |
| 28 / 7 | 1810 | 28 / 7 | 2030 |
| 28 / 7 | 2120 | 28 / 7 | 2300 |
| 30 / 7 | 0540 | 30 / 7 | 0745 |
| 31 / 7 | 1410 | 31 / 7 | 1615 |
| Beginning Time | Ending Time | ||
|---|---|---|---|
| Day/Month | HKT | Day/Month | HKT |
| 21 / 7 | 1430 | 22 / 7 | 1620 |
| 26 / 7 | 1620 | 28 / 7 | 2315 |
| Beginning Time | Ending Time | ||
|---|---|---|---|
| Day/Month | HKT | Day/Month | HKT |
| 10 / 7 | 0600 | 10 / 7 | 1340 |
| Meteorological Element | Figure of the Month | Departure from Normal* |
|---|---|---|
| Mean Daily Maximum Air Temperature | 31.0 degrees C | 0.3 degree below normal |
| Mean Air Temperature | 28.4 degrees C | 0.3 degree below normal |
| Mean Daily Minimum Air Temperature | 26.5 degrees C | 0.2 degree below normal |
| Mean Dew Point Temperature | 24.9 degrees C | 0.1 degree below normal |
| Mean Relative Humidity | 82 % | 1 % above normal |
| Mean Cloud Amount | 70 % | 2 % above normal |
| Total Rainfall | 471.1 mm | 96.7 mm above normal |
| Number of hours of Reduced VisibilityΔ | 29 hours | 10.5 hours above normal§ |
| Total Bright Sunshine Duration | 179.0 hours | 35.9 hours below normal |
| Mean Daily Global Solar Radiation | 16.91 Megajoule / square metre | 0.61 Megajoule below normal |
| Total Evaporation | 132.3 mm^ | 23.2 mm below normal |
| Remarks : | All measurements were made at the Hong Kong Observatory except sunshine, solar radiation and evaporation which were recorded at King's Park Meteorological Station and visibility which was observed at the Hong Kong International Airport. |
| Δ |
The visibility readings at the Hong Kong International Airport are based on hourly observations by professional meteorological observers in 2004 and before, and average readings over the 10-minute period before the clock hour of the visibility meter near the middle of the south runway from 2005 onwards. The change of the data source in 2005 is an improvement of the visibility assessment using instrumented observations following the international trend. |
* Departure from 1971 - 2000 climatological normal, except for number of hours of reduced visibility |
|
§ Departure from mean value between 1997 and 2007 |
|
^ Total for 30 days |
|