The Weather of December 2005
|
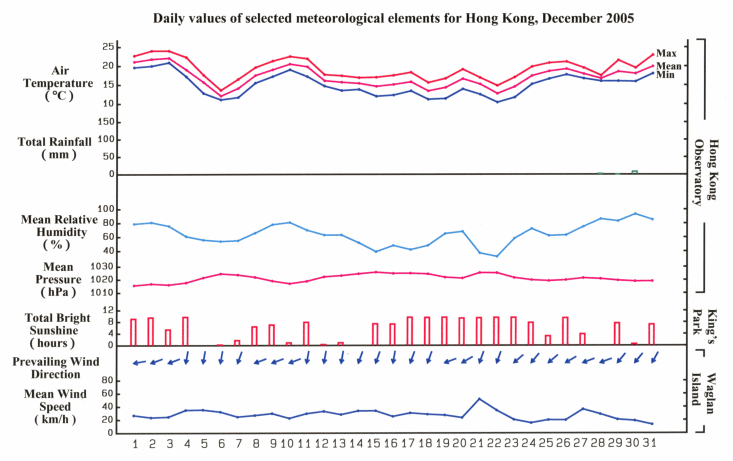
December 2005 was drier than normal with only 9.5 millimetres of rainfall. Despite a dry December, the year 2005 finished as the 3rd wettest year since record began in 1884. The annual rainfall was 3214.5 millimetres, some 45 percent above the normal figure of 2214.3 millimetres. It was fine but hazy in the first three days of December 2005. As a cold front moved across the south China coast in the early morning of 4 December, the visibility improved, and the weather turned cloudy, cold and dry in the ensuing three days. The first Cold Weather Warning of the winter was issued on 5 December. With the moderation of the northeast monsoon, there were sunny periods on 8 December and the weather was mild in the next three days. A surge of the winter monsoon reached Hong Kong again on the early morning of 12 December, bringing cool weather to the territory. The temperature and relative humidity dropped further on 15 December when the winter monsoon strengthened. It was cold and very dry in the next four days. The weather warmed up briefly on 20 December, but turned cold and windy again on 21 December when an intense surge of the winter monsoon arrived at southern China. Three people in Sham Tseng were hurt as they fell in strong winds that morning. The weather stayed cold and very dry on 22 and 23 December. The minimum temperature dropped to 10.4 degrees on 22 December, the lowest so far this winter. Frost was reported in the Sha Tin Racecourse on the morning of 23 December. The temperature rose gradually on 24 December as the winter monsoon weakened. It was mainly fine in the next three days. A cloud band associated with an area of low pressure over the South China Sea brought cloudy weather and some rain to the territory between 28 and 30 December. It was mainly fine on the last day of the year. Only one tropical cyclone occurred in the western North Pacific and the South China Sea in the month. |
|
Details of issuance and cancellation of various warnings/signals in the month are summarized in Tables 1.1 to 1.3. Monthly meteorological figures and departures from normal for December are tabulated in Table 2. |
Warnings and Signals issued in December 2005
| Beginning Time | Ending Time | ||
|---|---|---|---|
| Day/Month | HKT | Day/Month | HKT |
| 4 / 12 | 0245 | 4 / 12 | 1245 |
| 15 / 12 | 0245 | 15 / 12 | 0745 |
| 21 / 12 | 0615 | 22 / 12 | 1045 |
| Colour | Beginning Time | Ending Time | ||
|---|---|---|---|---|
| Day/Month | HKT | Day/Month | HKT | |
| Yellow | 4 / 12 | 0600 | 5 / 12 | 0600 |
| Red | 5 / 12 | 1130 | 8 / 12 | 0600 |
| Red | 8 / 12 | 1130 | 8 / 12 | 1800 |
| Yellow | 11 / 12 | 0600 | 12 / 12 | 0600 |
| Red | 12 / 12 | 0600 | 12 / 12 | 1800 |
| Red | 13 / 12 | 0600 | 13 / 12 | 1800 |
| Red | 14 / 12 | 0600 | 19 / 12 | 1800 |
| Red | 21 / 12 | 0000 | 23 / 12 | 1800 |
| Yellow | 23 / 12 | 1800 | 25 / 12 | 1115 |
| Red | 25 / 12 | 1115 | 26 / 12 | 0600 |
| Yellow | 26 / 12 | 0600 | 27 / 12 | 1800 |
| Beginning Time | Ending Time | ||
|---|---|---|---|
| Day/Month | HKT | Day/Month | HKT |
| 5 / 12 | 1600 | 7 / 12 | 1145 |
| 14 / 12 | 1600 | 16 / 12 | 1130 |
| 17 / 12 | 1630 | 19 / 12 | 1130 |
| 21 / 12 | 1600 | 23 / 12 | 1130 |
| Meteorological Element | Figure of the Month | Departure from Normal* |
|---|---|---|
| Mean Daily Maximum Air Temperature | 19.1 degrees C | 1.4 degrees below normal |
| Mean Air Temperature | 17.0 degrees C | 0.6 degree below normal |
| Mean Daily Minimum Air Temperature | 15.0 degrees C | 0.4 degree below normal |
| Mean Dew Point Temperature | 9.7 degrees C | 1.5 degrees below normal |
| Mean Relative Humidity | 64 % | 4 % below normal |
| Mean Cloud Amount | 59 % | 10 % above normal |
| Total Rainfall | 9.5 mm | 17.8 mm below normal |
| Number of hours of Reduced VisibilityΔ | 276 hours | 58.4 hours above normal§ |
| Total Bright Sunshine Duration | 179.7 hours | 1.8 hours below normal |
| Mean Daily Global Solar Radiation | 11.41 Megajoule / square metre | 0.62 Megajoule below normal |
| Total Evaporation | 99.4 mm | 12.1 mm below normal |
| Remarks : | All measurements were made at the Hong Kong Observatory except sunshine, solar radiation and evaporation which were recorded at King's Park Meteorological Station and visibility which was observed at the Hong Kong International Airport. |
| Δ |
The visibility readings at the Hong Kong International Airport are based on hourly observations by professional meteorological observers in 2004 and before, and average readings over the 10-minute period before the clock hour of the visibility meter near the middle of the south runway from 2005 onwards. The change of the data source in 2005 is an improvement of the visibility assessment using instrumented observations following the international trend. |
* Departure from 1961-1990 climatological normal, except for number of hours of reduced visibility. |
|
| § Departure from mean value between 1997 and 2004. | |