The Year's Weather - 2016
Friday, 6th January 2017
According to the World Meteorological Organization’s preliminary assessment, 2016 is very likely to be the world’s warmest year on record. Over the Arctic, with unusually high air and sea surface temperatures, the sea ice extent based on satellite observations was well below average throughout the year with seven months (up to November 2016) hitting a record low. Various extreme weather events wreaked havoc in many parts of the world in 2016, including heatwaves in Africa, southeast Asia and Middle East, damaging wildfire in Canada and Tasmania, cold spells in southern China and the eastern United States, drought in southern Africa, northern South America, Central America and the Caribbean, Vietnam, parts of India, Indonesia, the Philippines, various islands of the tropical western Pacific, Ethiopia and parts of eastern Australia, extreme rainfall and flooding in Yangtze and Beijing regions of China, Sri Lanka, India, western Europe, Niger river basin and Australia, and severe damages and heavy casualties due to tropical cyclones in Haiti, Cuba, the Bahamas, China, the Korean Peninsula and the east coast of the United States.
Over the central and eastern equatorial Pacific, the strongest and longest El Niño event since 1950 weakened steadily during the early months of 2016, with sea surface temperatures returning to ENSO-neutral conditions in May and becoming slightly below normal towards the end of the year.
The weather in Hong Kong was also warmer than usual in 2016 with an annual mean temperature of 23.6 degrees, 0.3 degree above the 1981-2010 normal[1] (or 0.6 degree above the 1961-1990 normal) and among the seventh warmest since records began in 1884. In particular, the mean temperatures for summer (June to August) and autumn (September to November) ranked the third highest and fifth highest respectively on record.
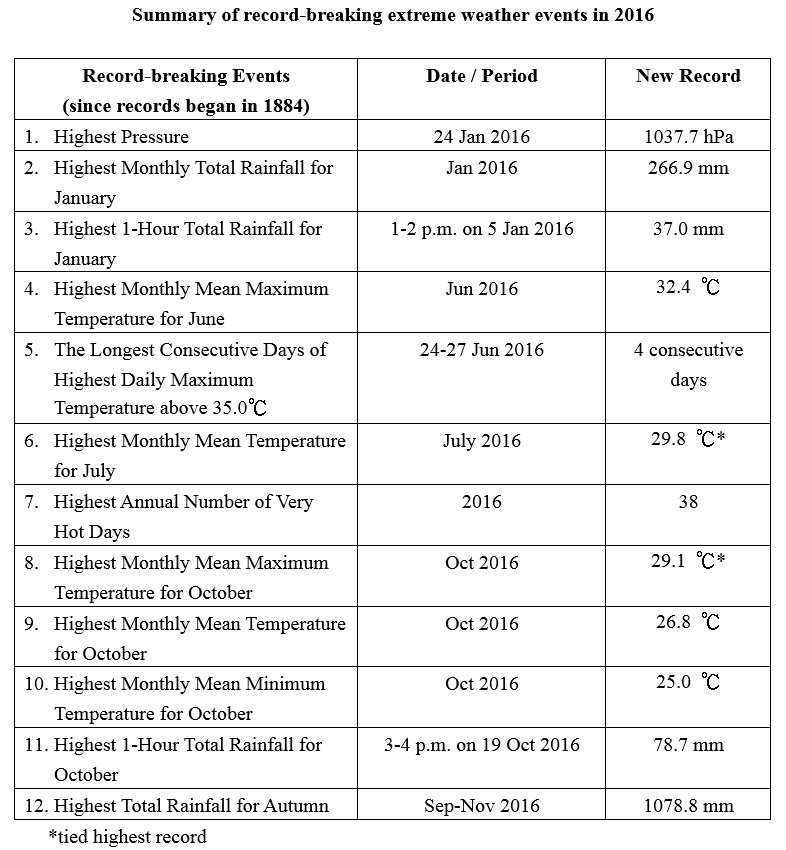
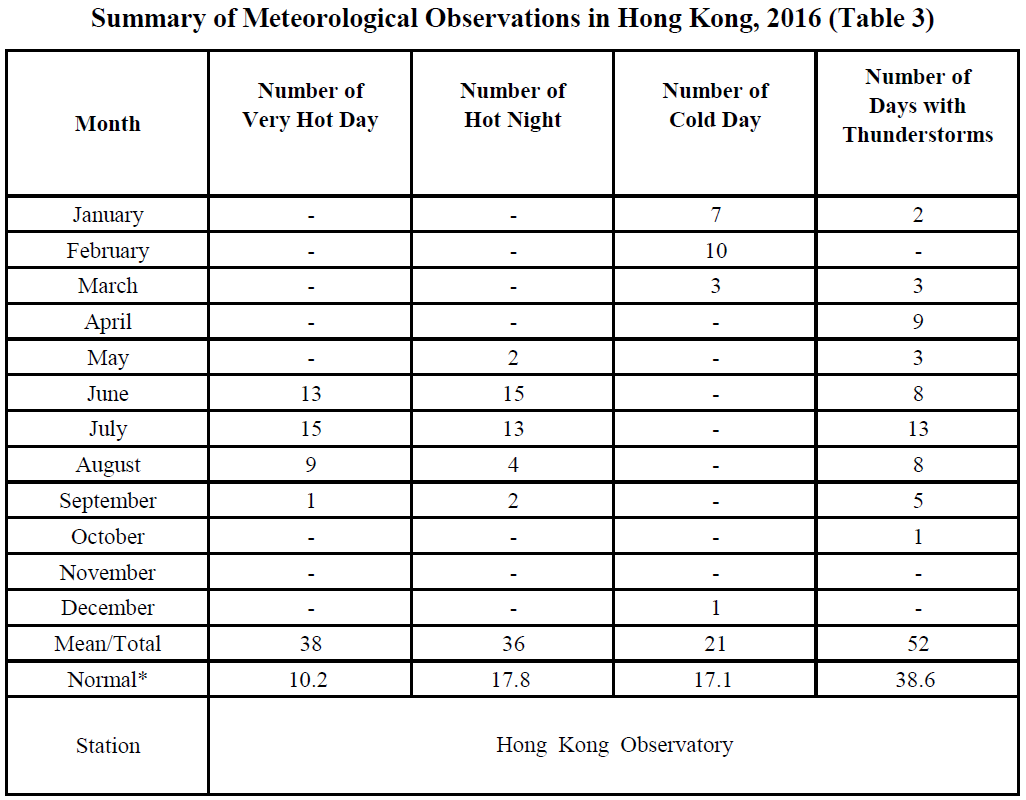
For high temperatures, there were 38 Very Hot Days[2] and 36 Hot Nights[3] in Hong Kong in 2016, ranking the highest and the second highest on record respectively. The highest temperature recorded at the Hong Kong Observatory in the year was 35.6 degrees on 9 July.
For low temperatures, the number of Cold Days[4] in the year was 21 days, 4 days more than the 1981-2010 normal. The lowest temperature recorded at the Hong Kong Observatory in the year was 3.1 degrees on 24 January.
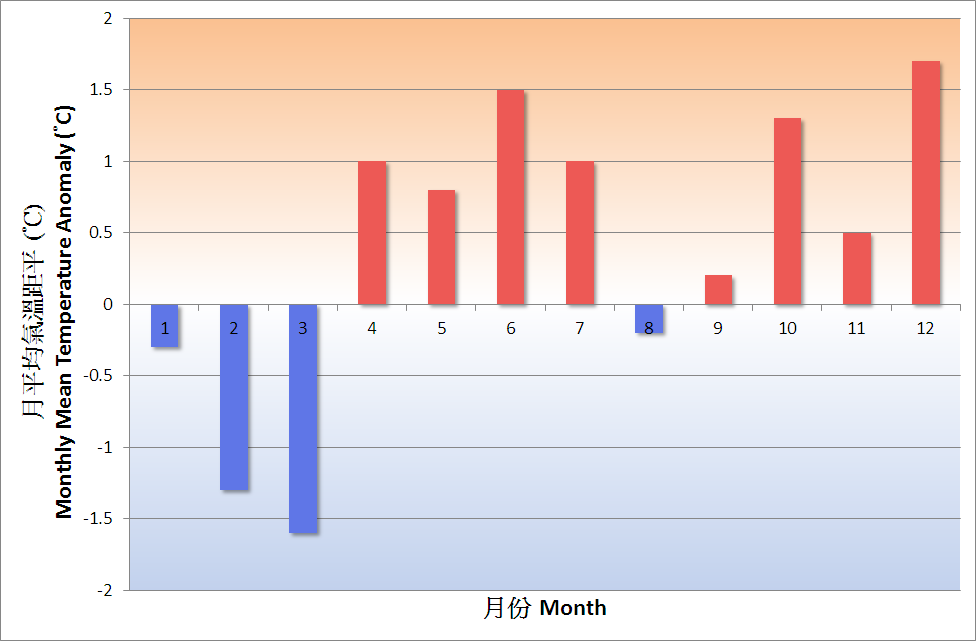
Fig. 1 Monthly mean temperature anomalies in Hong Kong in 2016
The year 2016 brought more rain than normal in Hong Kong. With a record-breaking autumn rainfall of 1078.8 millimetres, the annual total rainfall amounted to 3026.8 millimetres, a surplus of 26 percent comparing to the 1981-2010 normal of 2398.5 millimetres (or about 37 percent above the 1961-1990 normal) and ranking the ninth highest on record. On 19 October, torrential rain induced by the combined effect of a tropical cyclone (Sarika) and the northeast monsoon necessitated the issuance of the first ever Black Rainstorm Warning in October since the Rainstorm Warning System commenced operation in 1992. The number of days with thunderstorms reported in Hong Kong was 52 days in 2016, about 13 days more than the 1981-2010 normal.
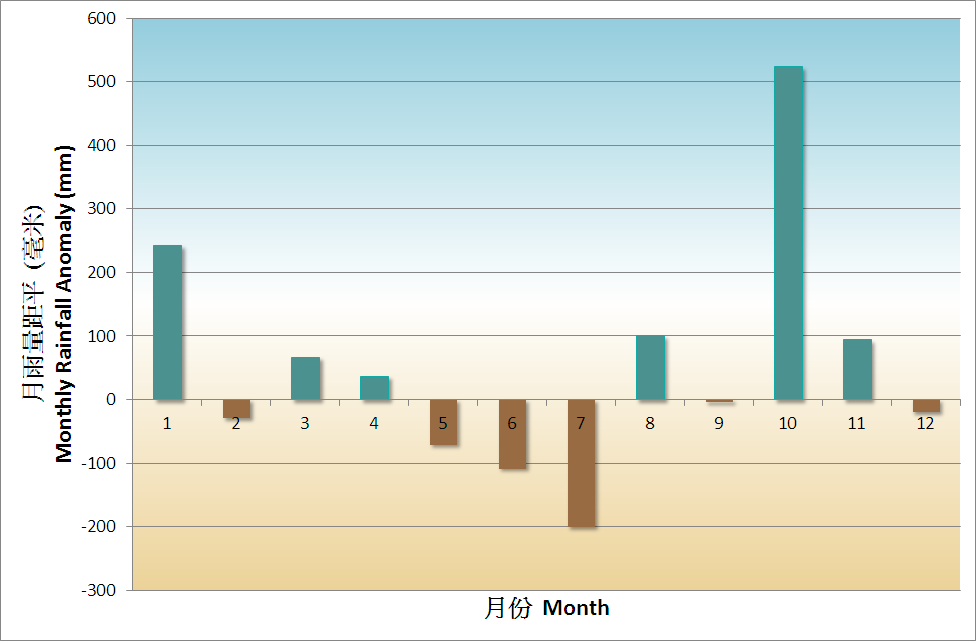
Fig. 2 Monthly rainfall anomalies in Hong Kong in 2016
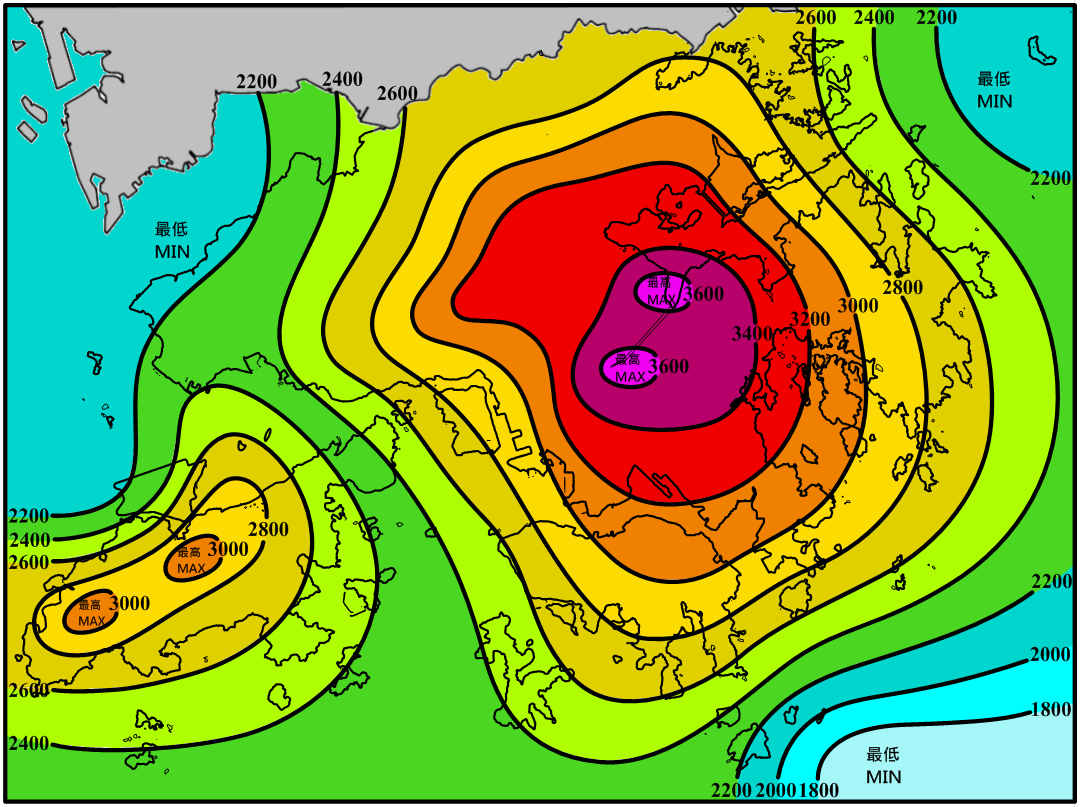
Fig. 3 Annual rainfall distribution (millimetres) in Hong Kong in 2016
A total of 28 tropical cyclones occurred over the western North Pacific and the South China Sea in 2016, less than the long-term (1961-2010) average of around 30. There were 13 tropical cyclones reaching typhoon intensity[5] or above during the year, less than the long-term average of about 15, and seven of them reached super typhoon intensity (maximum 10-minute wind speed of 185 km/h or above near the centre). In Hong Kong, nine tropical cyclones necessitated the issuance of tropical cyclone warning signals, higher than the long-term average of about six in a year. The No. 8 Gale or Storm Signals were issued during the passage of Nida in August and Haima in October.
Detailed description of the weather for individual months is available on the Monthly Weather Summary webpage:
http://www.hko.gov.hk/wxinfo/pastwx/mws.htm
Some significant weather events in Hong Kong in 2016 are highlighted below:
A Freezing Cold Surge in January
An intense cold surge with freezing temperatures affected Hong Kong during 23 - 25 January. Temperatures at the Hong Kong Observatory dropped to a minimum of 3.1 degrees on the afternoon of 24 January, the coldest day since 1957 and one of the sixth lowest on record. Sub-zero temperatures were recorded on high ground with temperatures at Tai Mo Shan falling to a minimum of -6.0 degrees. There were widespread frost, rime, icing, freezing rain and ice pellets on high ground and in some parts of the New Territories.
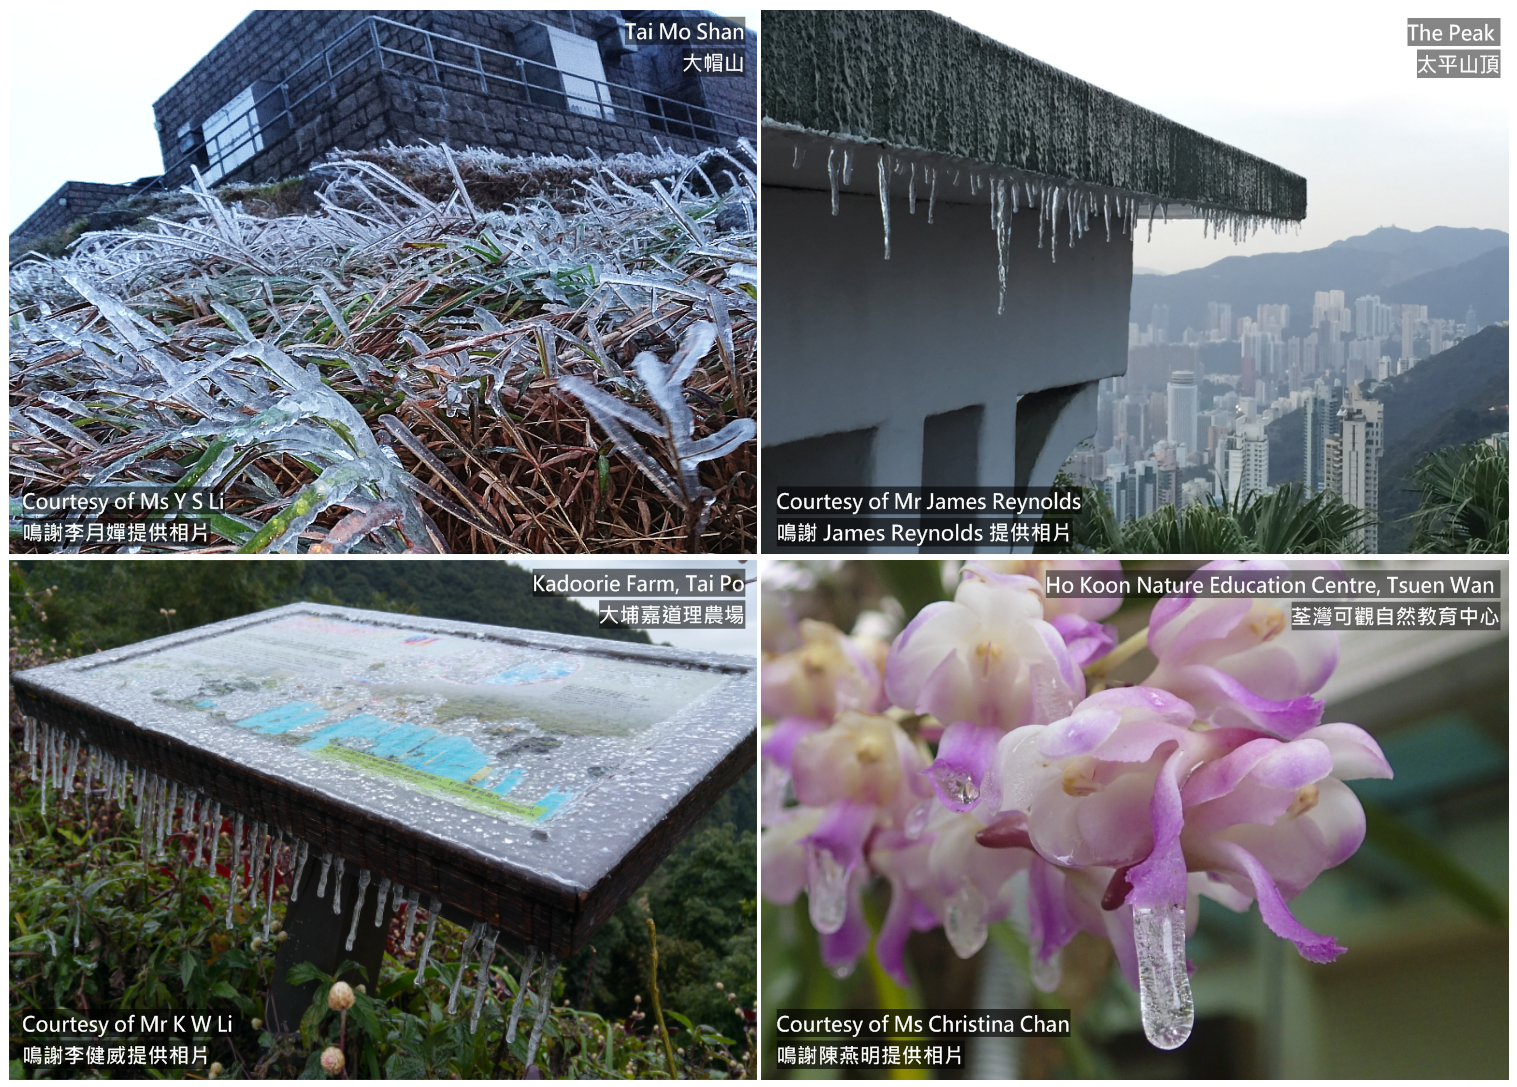
Fig. 4 Icing reported at various places in Hong Kong on 24 January 2016
High Temperatures in Summer and Autumn
Hong Kong experienced the third hottest summer in 2016 since records began in 1884 with the mean temperature for June to August reaching 29.2 degrees, 0.8 degree above the normal figure of 28.4 degrees.
June 2016 was the second hottest June in Hong Kong on record. The monthly mean temperature of 29.4 degrees was 1.5 degrees above the normal figure of 27.9 degrees. Daily maximum temperatures at the Hong Kong Observatory soared above 35.0 degrees for four consecutive days on 24 - 27 June, breaking the previous record of three consecutive days from 30 May to 1 June in 1963.
July 2016 was one of the hottest July on record with the monthly mean temperature reaching 29.8 degrees, 1.0 degree above the normal figure of 28.8 degrees and on par with the record set in July 2014. The daily maximum temperature at the Hong Kong Observatory reached 35.6 degrees on 9 July, the second highest on record for July.
The weather in Hong Kong was also unseasonably warm in autumn. The mean temperature for September to November 2016 reached 25.7 degrees, one of the fifth highest on record. In particular, October 2016 was the warmest October on record. The monthly mean maximum temperature of 29.1 degrees, monthly mean temperature of 26.8 degrees and monthly mean minimum temperature of 25.0 degrees were all 1.3 degrees above their respective normals and were the highest ever on record for October.
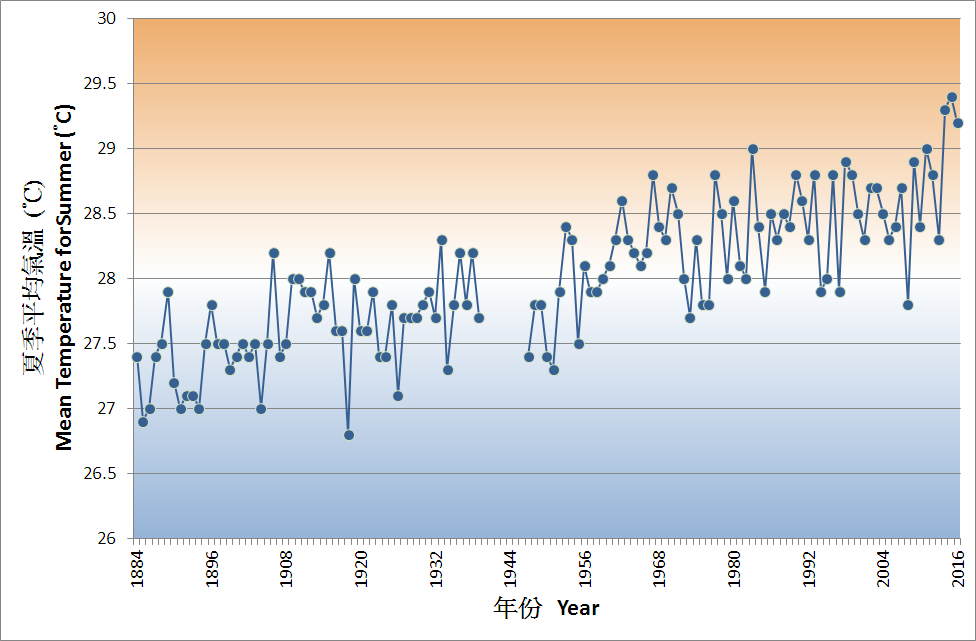
Fig. 5 Long-term trend of summer mean temperature (June to August) recorded at the Hong Kong Observatory
Extreme Rainfall in January and October
With active upper-air disturbances affecting the south China coastal areas and bringing outbreaks of heavy rain to Hong Kong in January, the Observatory recorded a total of 266.9 millimetres in the month, more than ten times the January normal of 24.7 millimetres and the highest for January since records began in 1885. Moreover, an hourly rainfall amount of 37 millimetres was recorded at the Observatory between 1 p.m. and 2 p.m. on 5 January, the highest hourly rainfall on record for January. The downpour that day also necessitated the issuance of the Amber Rainstorm Warning, the earliest issued since the rainstorm warning system commenced operation in 1992.
Due to rainstorms in early October and spells of rainy weather associated with tropical cyclones Sarika and Haima between 16 and 21 October, the monthly rainfall recorded in October was 624.4 millimetres, more than six times the October normal of 100.9 millimetres and the second highest on record for October. In particular, torrential rain on 19 October necessitated the issuance of the first ever Black Rainstorm Warning in October since the Rainstorm Warning System commenced operation in 1992. The hourly rainfall amount of 78.7 millimetres between 3 p.m. and 4 p.m. that day was also the highest in October on record.
With rainfall in October and November well above normal, the seasonal rainfall for autumn (September to November) reached 1078.8 millimetres, more than double the autumn normal and the highest on record.

Fig. 6 Severe flooding at Ching Cheung Road (left) and Chai Wan Road (right) on 19 October 2016 (courtesy of Drainage Services Department)
An Active Typhoon Season
Nine tropical cyclones necessitated the issuance of local tropical cyclone warning signals during the year, the highest since 1993. In particular, it was the first time since 1975 that three tropical cyclones necessitated the issuance of tropical cyclone warning signals in October. The No. 8 Signal was raised for Haima, the first time in October since Typhoon Sibyl in 1995. The active tropical cyclone season this year was mainly due to warmer-than-normal sea surface temperature near the Philippines and over the northern part of the South China Sea, as well as favourable atmospheric patterns over the western North Pacific that provided favourable steering flow for tropical cyclones to move towards the South China Sea.
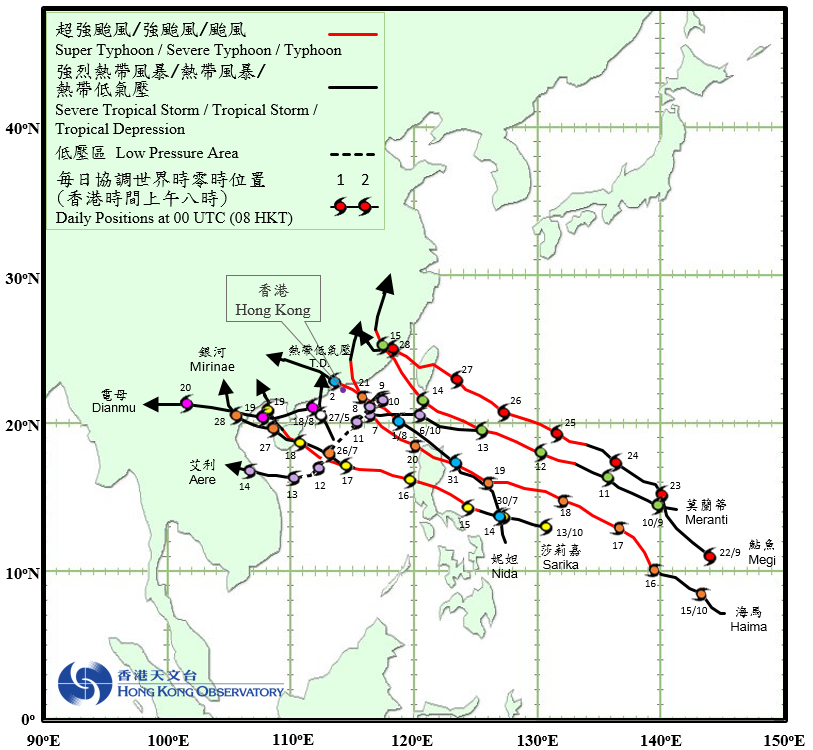
Fig. 7 Tracks of the nine tropical cyclones affecting Hong Kong in 2016
Notes :
[1] Climatological normals for the reference period of 1961-1990, 1971-2000 and 1981-2010 are available at : http://www.weather.gov.hk/cis/normal_e.htm.
Climatological normals of 1981-2010 are referenced in the text unless otherwise stated.
[2] 'Very Hot Day' refers to the condition with the daily maximum temperature equal to or higher than 33.0 degrees.
[3] 'Hot Night' refers to the condition with the daily minimum temperature equal to or higher than 28.0 degrees.
[4] 'Cold Day' refers to the condition with the daily minimum temperature equal to or lower than 12.0 degrees.
[5] Information on the classification of Tropical Cyclones is available at: http://www.hko.gov.hk/informtc/class.htm
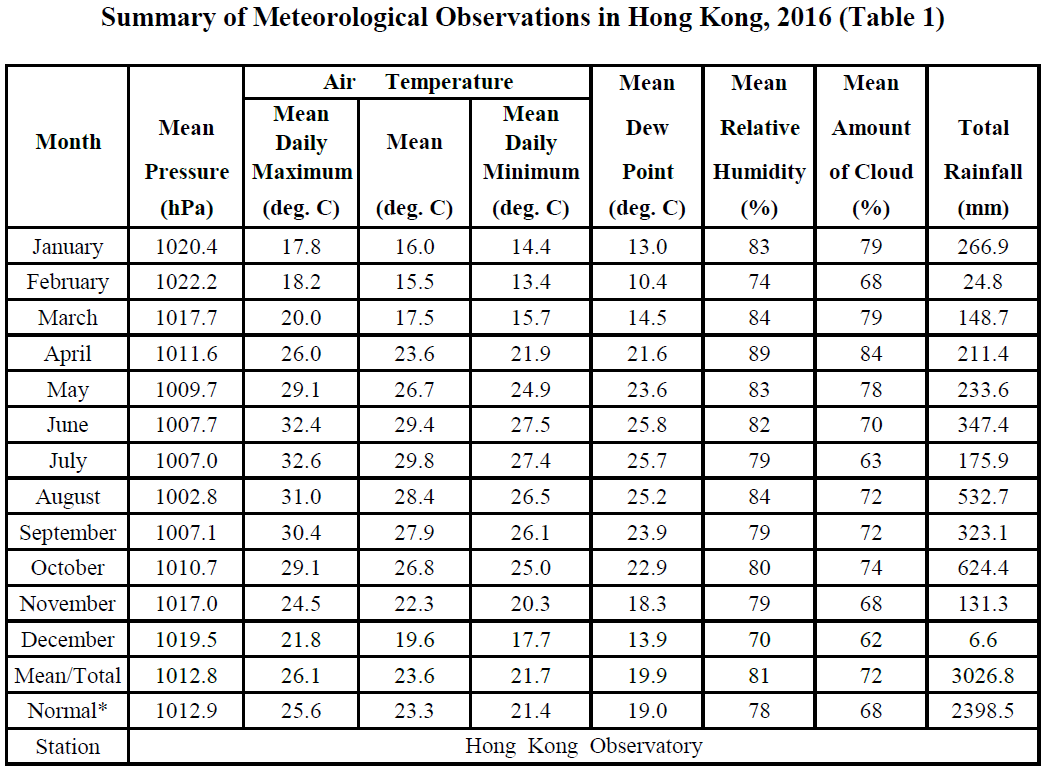
* 1981-2010 Climatological Normal, unless otherwise specified
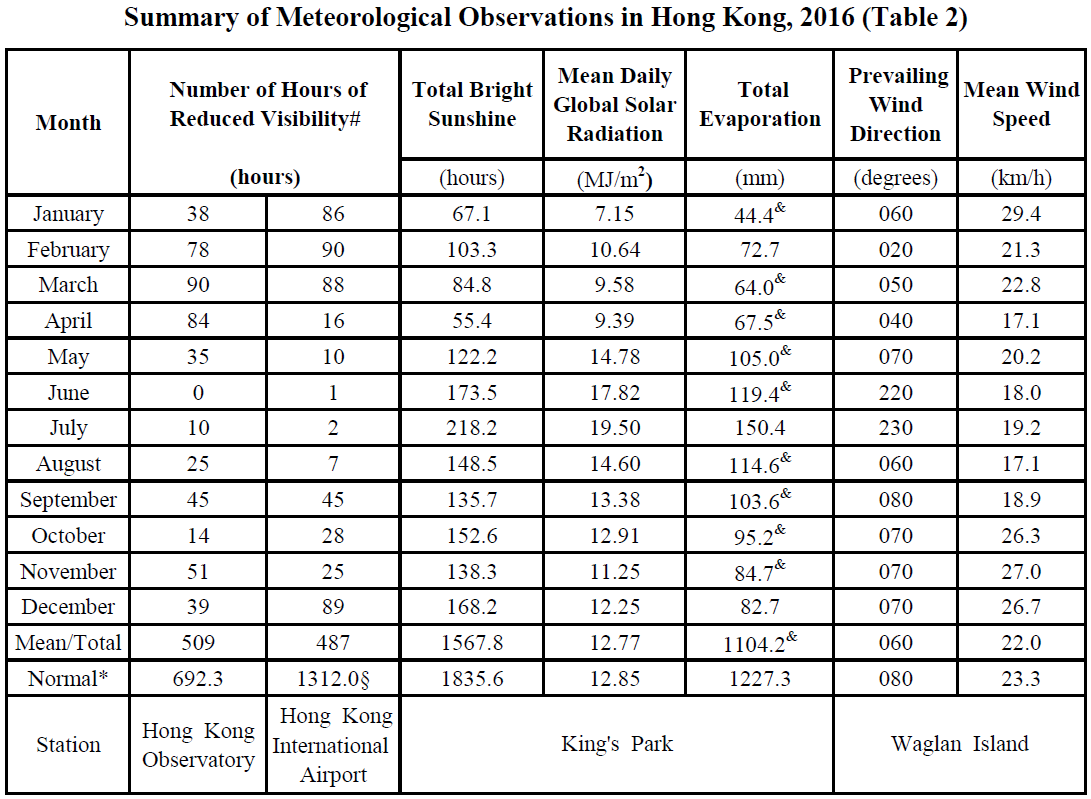
# Visibility below 8 km when there is no fog, mist, or precipitation
* 1981-2010 Climatological normal, unless otherwise specified
§ 1997-2015 Mean value
& data incomplete
^ In case the data are not available from Waglan Island, observations of Cheung Chau or other nearby weather stations will be incorporated in computing the Prevailing Wind Direction and Mean Wind Speed
* 1981-2010 Climatological Normal, unless otherwise specified