Computer weather forecasts now to cover upper air
Computer weather forecasts now to cover upper air (2 June 2005)
|
Starting from today (June 2), the Hong Kong Observatory's "Computer-generated Forecast Weather Charts" on the Internet (http://www.weather.gov.hk/nwp/nwpe.htm) will be enhanced to cover weather information in the upper air as well.
This will enable the public to gain more insight into the driving mechanisms behind the weather affecting Hong Kong and its neighbouring regions in the next two to three days. It will also provide special users, such as the air transport industry and aviation enthusiasts, with a more comprehensive set of prognostic information for reference.
Apart from the original set of surface charts on temperatures, wind direction and wind speed, mean sea level pressure and weather conditions, the contents of the new computer upper-air forecast charts include spatial distributions of key weather elements at four different layers within the troposphere, as well as an explanatory note to facilitate understanding and application by the general public.
The launch of the "Computer-generated (Surface) Forecast Weather Charts" in June last year has been welcomed by the public. To enhance public understanding and interpretation of these charts, the observatory organised two training sessions -- "Basic Course on Numerical Weather Prediction" -- in July and November last year.
Mr Chan Chik-cheung, Senior Scientific Officer in charge of the course, said, "The course proved to be extremely popular and attracted a lot of positive reviews. Some of the participants expressed their wish to have access to information on the meteorological conditions in the upper air as well."
Dr Wong Ming-chung, Assistant Director of the observatory, explained, "The atmosphere is a three-dimensional entity. Changes in the weather patterns at the surface and higher up in the atmosphere are closely related. As such, in the formulation of forecasting strategies, surface and upper-air weather charts must be taken as a whole if the evolutionary weather patterns are to be properly understood." The newly added upper-air charts are intended to facilitate better understanding of the evolution of the weather systems.
Regarding detailed weather forecasts for specific cities, Dr Wong advised the public to retrieve the relevant information directly from the two World Meteorological Organization websites managed by the Hong Kong Observatory, World Weather Information Services (http://www.worldweather.org) and Severe Weather Information Centre (http://severe.worldweather.org).
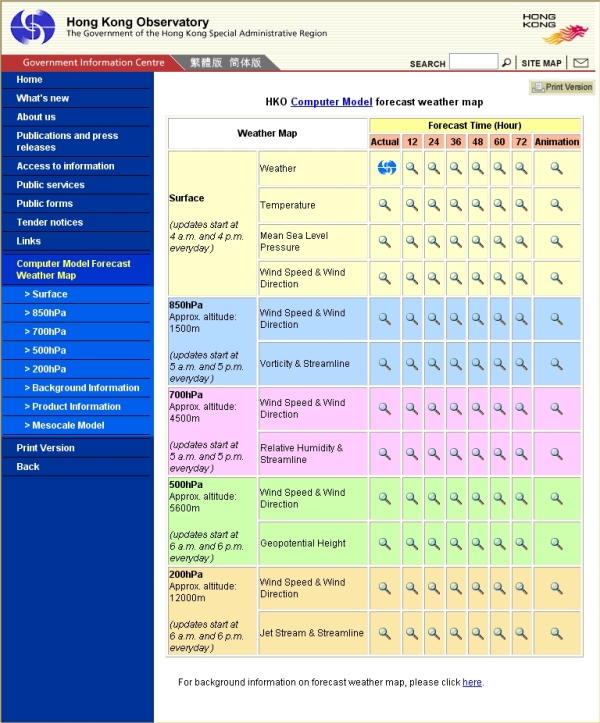
Figure 1 Overview of the Observatory's "Computer-generated Forecast Weather Charts" on the Internet.
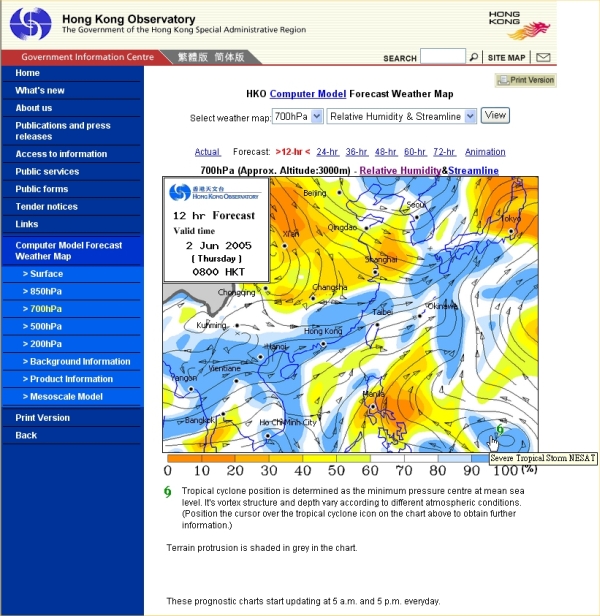
Figure 2 Upper-air (about 3,000 metres above mean sea level) streamline and relative humidity distribution chart forecast by the computer model. Moist (in blue) and dry regions (in orange/yellow) correspond to areas with relatively higher chance of cloudy and clear weather respectively
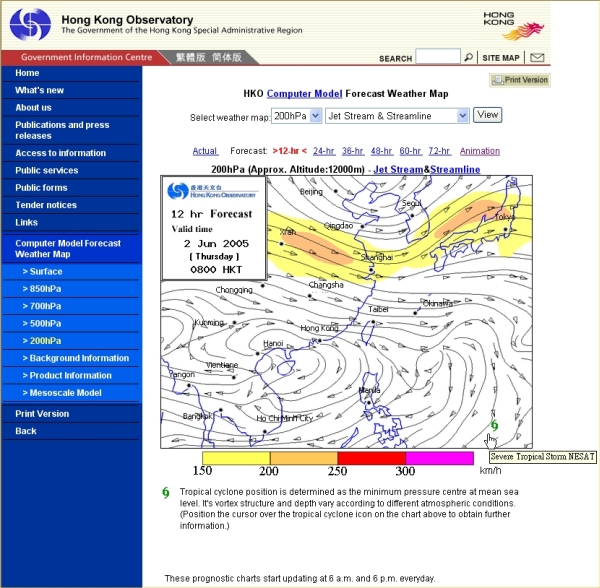
Figure 3 Upper-air (about 12,000 metres above mean sea level) streamline and jetstream distribution chart forecast by the computer model. Coloured areas with wind speed exceeding 150 km per hour correspond to the coverage extent of the upper-level jetstream. |