Hong Kong Observatory Lightning Location Information System
User Guide to Location-specific Lightning Alert Webpage
 |
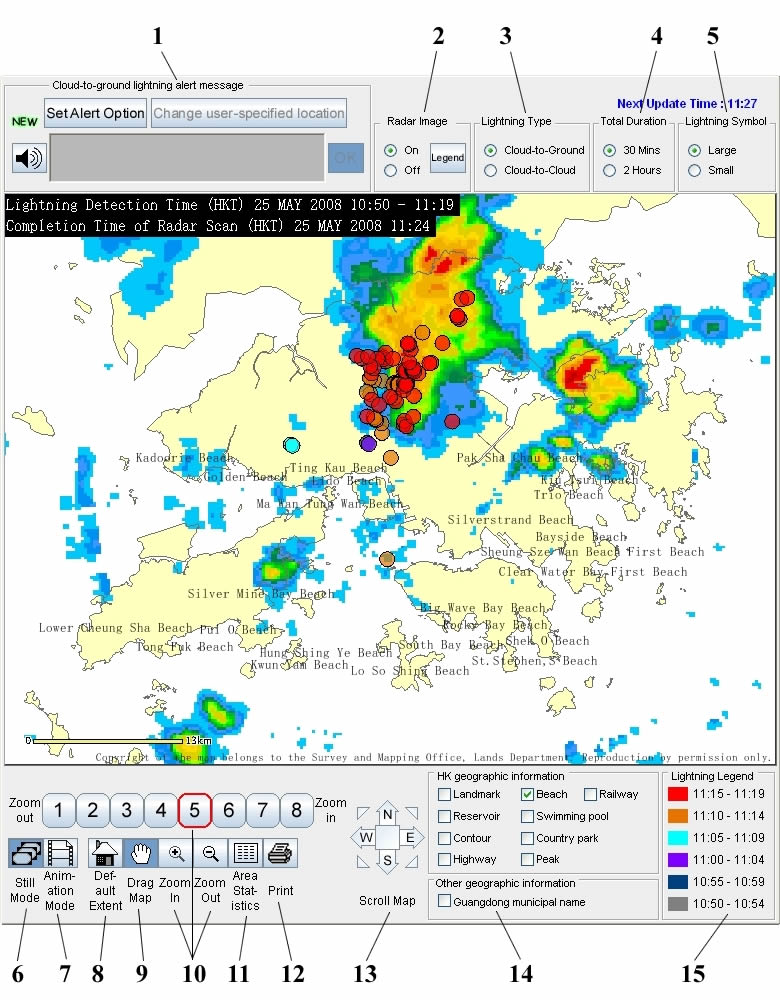
The Location-specific Lightning Alert webpage displays the location of lightning strokes over the Pearl River Estuary detected by the Lightning Location Network and provides the lightning alert function. The basic features of the interactive lightning location map are described below:

- Lightning Alert - Click the
 button to enable/disable the location-specific lightning alert. Click here for details of the location-specific lightning alert.
- Radar Image - Click the On/Off option button to overlay/remove radar image. Click the
 button to see how the rainfall rates are represented by different colours.
- Lightning Type - Click the option buttons to select the display of cloud-to-ground or cloud-to-cloud lightning.
- Total Duration - Click the option buttons to select the display of lightning information during the past 30 minutes or 2 hours.
- Lightning Symbol - Click the option buttons to select Large or Small circles to represent lightning on the map.
- Still Mode - Click the
 button to change from Animation Mode to Still Mode for the display of lightning information. In still mode, different colours are used to represent different time of occurrence of lightning.
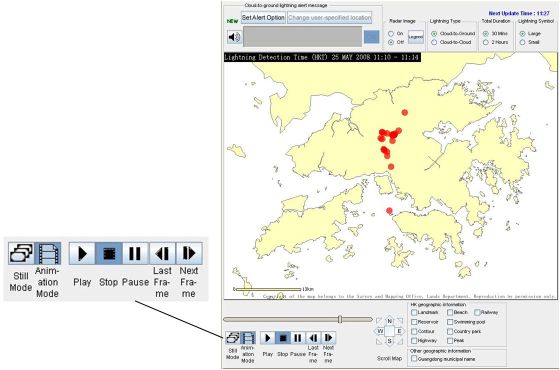
- Animation Mode - Click the
 button to change from Still Mode to Animation Mode for the display of lightning information. Use the pop-up buttons to Play, Stop, Pause, return to Last Frame or proceed to Next Frame of the animation.

- Default Extent - Click the
 button to return to the default map scale which shows the Hong Kong region.
- Drag Map - To view another region of the map, click the
 button and then drag the map.
- Zoom In and Out - You can zoom in/out by clicking the buttons for different map scales
 . Alternatively, you can click the
  or
or  button and then click on the map with the
  or
or  tool to zoom in or out.
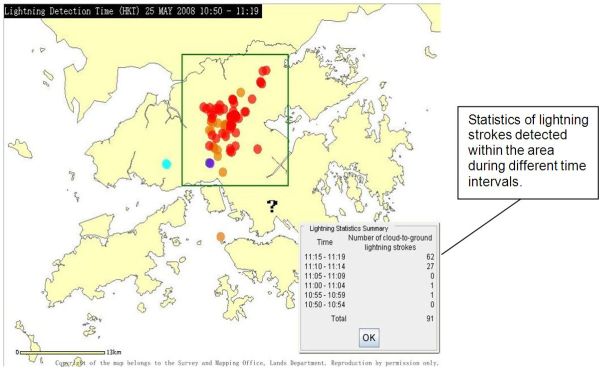
- Area Statistics - Click the
 and then drag a rectangle on the map. The number of lightning strokes detected within the rectanglular area will then be calculated.

- Print - Click the
 button to print the map.
- Scroll Map - Click the Scroll Map arrows
 to move the map in any one of the eight compass directions.
- Geographic Information - Check the boxes to add geographical reference overlays to the map. These overlays include landmarks, beaches, railways, reservoirs, swimming pools, highways, country parks and peaks of Hong Kong, and municipal names of the Guangdong province.
- Lightning Legend - Lightning detected during different time intervals are represented by different colours as shown in the legend.

