Tropical cyclone track maps get a facelift
31 August 2018
Tropical cyclone forecast track maps on the Hong Kong Observatory’s “Tropical Cyclone Track and Position” webpage (Fixed-area map version) were revamped today (31 August 2018) for easy viewing and sharing by members of the public. Apart from an enlarged spatial coverage, the new track maps also use different colours to indicate the different intensities of tropical cyclone. When overlaid on top of satellite basemap, such important information is more easily comprehended at a glance.
URL: https://www.hko.gov.hk/wxinfo/currwx/tc_fixarea_e.htm
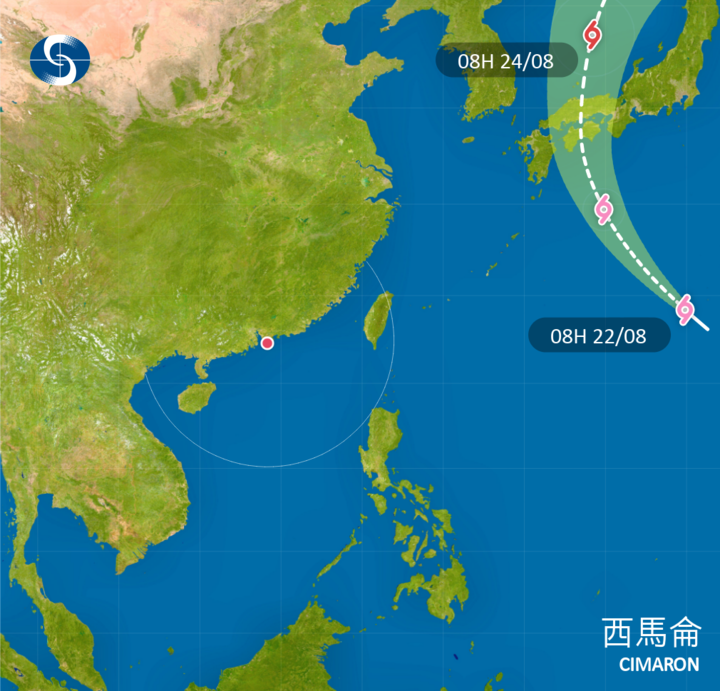
The enlarged track map can now clearly show tropical cyclone activities near places like Japan and Korea. This example shows the forecast track for Tropical Cyclone Cimaron in August 2018.
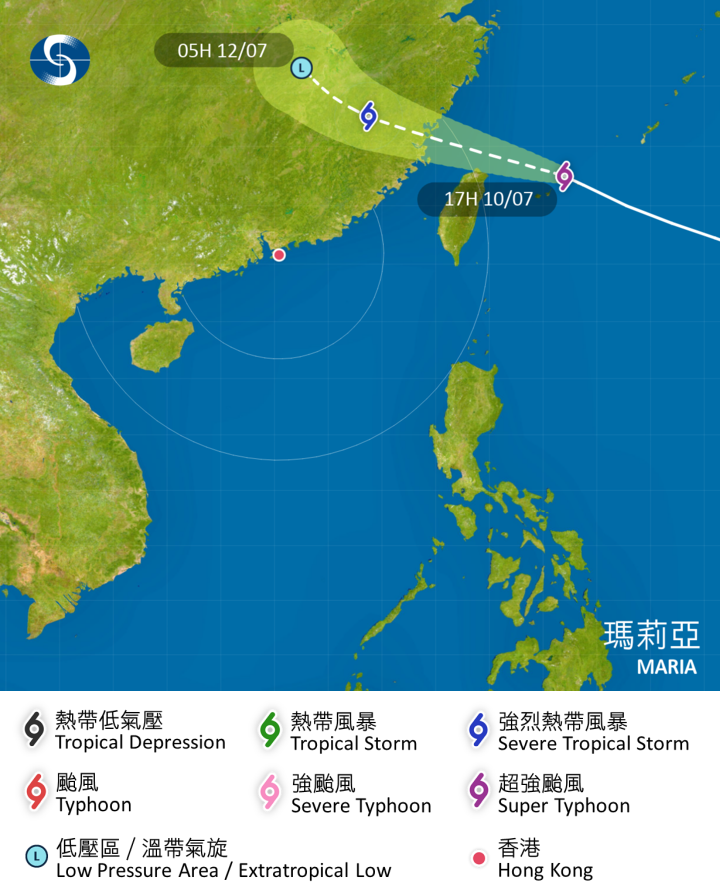
Track maps use different colours to indicate different intensities of tropical cyclone. This example in July 2018 shows that Super Typhoon (purple cyclone symbol) Maria would weaken into a severe tropical storm (blue cyclone symbol) upon landfall over Fujian, dissipating gradually afterwards (the “L” symbol stands for low pressure area).
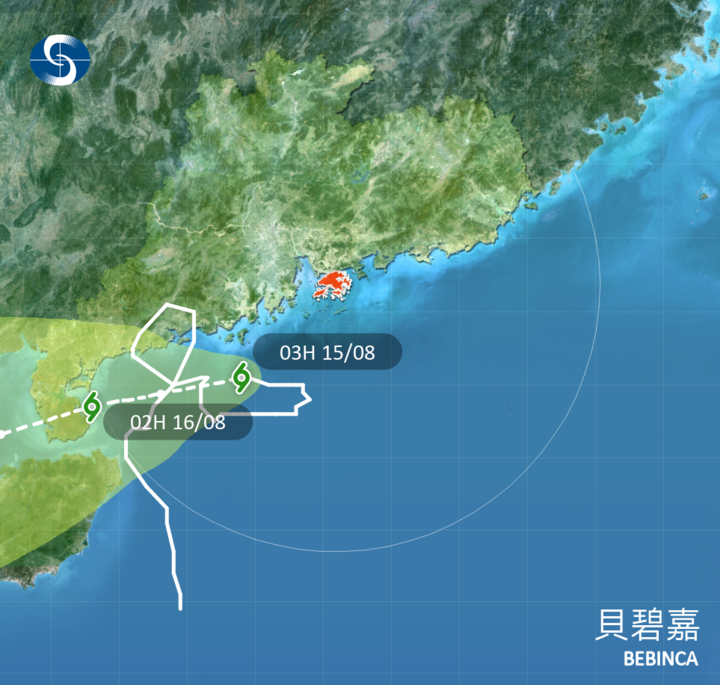
The zoomed-in track map can delineate more clearly the subtle changes in movement when a tropical cyclone moves near to the coast of Guangdong. This example shows the meandering track of Tropical Cyclone Bebinca in August 2018.