A Facelift of the Regional Weather Charts on the Homepage
15 October 2012
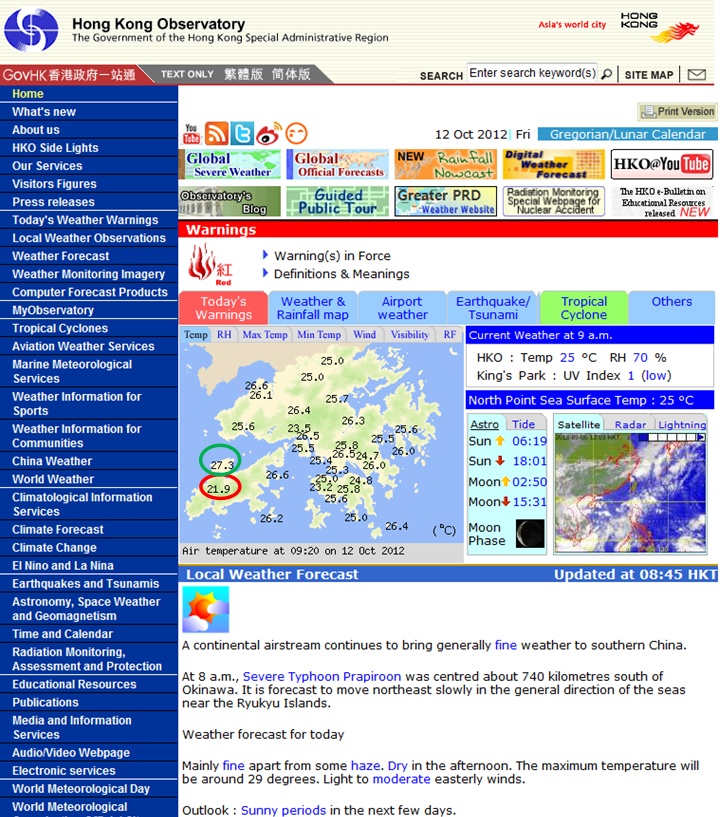
| To enable better understanding about influence of terrain on weather by the general public, the regional weather chart on the homepage of HKO website has been enhanced with base map containing terrain information. For instance, the diagram below shows that there was a temperature difference of more than 5 degrees between the Ngong Ping weather station [Note] (location circled in red) and the Chek Lap Kok weather station [Note] (location circled in green) at its north. This is a good example to illustrate that temperature generally falls with height. Note: Elevation of Ngong Ping weather station is 593 m above mean sea level while elevation of Chek Lap Kok weather station is 6m above mean sea level.
|