WEATHER ON WINGS
Newsletter for the Aviation Community
Hong Kong Observatory Issue No. 13 May 2000
Seminar on Meteorological Information Exchange between Hong Kong and Mainland
A delegation from Air Traffic Management Bureau, Civil Aviation Administration of China (CAAC/ATMB) visited the Hong Kong Observatory (HKO) and participated in a seminar on aviation meteorological services and information exchange during 18 20 January 2000, under a Memorandum of Long Term Technical Co-operation between HKO and CAAC/ATMB. HKO and CAAC/ATMB introduced their aviation weather services to each other, and exchanged views in respect of future cooperation and data communication. The delegation also visited the Airport Meteorological Office at Chek Lap Kok. Both sides considered the exchange very useful and fruitful.
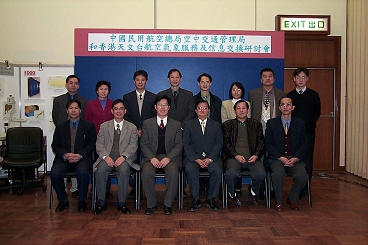
Fig. 1 Visit by a delegation from CAAC/ATMB
13th Liaison Group Meeting on Aviation Weather Services
The 13th Meeting was held at the Conference Hall of the HKO on 23 December 1999. Twelve members participated. Dr. H.K. Lam, Director of the HKO, said that the past six months had been very exciting weather-wise, with the passage of three tropical cyclones through Hong Kong, necessitating for the case of Typhoon York the hoisting of the No. 10 signal for the first time in 16 years. It was very unfortunate an aircraft accident occurred on 22 August 1999 during the passage of Typhoon Sam. The HKO had contributed the necessary weather information for the accident investigation. Dr. Lam reported that the HKO had obtained funds for a LIght Detection And Ranging (LIDAR) system to detect low-level windshear in clear weather, and thanked the airlines for their support. He said that the planned installation of the LIDAR in 2002 would be an important step in improving HKO's windshear and turbulence warning capability.
World Area Forecast System (WAFS) Transition
In accordance with the WAFS transition plan for Asia/Pacific Region, the following would take place in phases:-
(a) World Area Forecast Centres (WAFCs) would take over responsibility from Regional Area Forecast Centres (RAFCs);
(b) WAFS Transition Task Force to assess requirement for a regional Medium Level SIGWX (SWM) chart in July 2000 and the implementation of regional SWM chart in December 2000;
(c) Provision of BUFR decoding software to States in late 2001;
(d) Satellite distribution of global High Level SIGWX (SWH)/SWM products in BUFR in early 2002;
(e) Removal of T4 fax charts from satellite broadcast around 2003/04; and
(f) Implementation of final phase of WAFS in 2004.
With a view to standardizing flight documents as a result of the above international trend, the HKO would implement the following changes around June 2000:-
(a) SWH charts in flight documents would be replaced by the most appropriate WAFS chart(s). Same for Wind/Temperature charts.
(b) HKO would provide SWM (FL100-250) chart in place of the existing Low/Medium Level SIGWX (SWL/M) (< FL250) chart until such time SWM chart(s) becomes available from WAFS.
Airlines are being requested to consider whether additional SWM chart(s) would be required from WAFS for flight operations (e.g. ETOPS) in Asia/Pacific Region.
Over the past 10 years, the number of fight documents prepared for our airline users increased at a rate of over 5% a year (Fig. 2). Last year, over 80,000 flight documents were delivered to airline users via Meteorological Information Dissemination System (MIDS) making up 90% of all the flight documents prepared for flights departing from Chek Lap Kok. As of April 2000, the number of registered users of the MIDS has increased to a total of 47. Besides flight documents, users can also gain access a host of local weather information extracted from different sources. The most popular pages are 'Winds Around the Hong Kong International Airport (HKIA)' (Fig. 3) and the 'HKIA METPAGE' which displays the current weather report and forecast for the airport. To provide faster user access to the information on the MIDS, connections to the system are now operating at a speed of 56,000 bps (bits per second). For high volume users, Integrated Services Digital Network (ISDN) access is also available.
 |
 |
| Fig. 2 Statistics of flight documents issued to airlines | Fig. 3 One of the most popular pages on MIDS |
Windshear Caused by Sea Breeze on 22 January 1999
It has long been recognized that sea breeze, an air-sea-land interaction induced by differential heating on land and sea surface, can produce windshear. At Chek Lap Kok, previous studies showed that sea breezes usually invade from the west or southwest as Chek Lap Kok and the New Territories heat up to draw in the air. When the surface wind is from the opposite direction, i.e. from the east, the approach of sea breezes would induce significant convergence and thus lifting windshear.
On 22 January 1999, a number of windshear reports were received (Table 1) from arriving flights caused by sea breeze convergence.
A moderate to fresh easterly airstream was affecting the south China coastal areas on 22 January 1999. Locally, it started off cloudy in the morning. The clouds gradually dispersed during the day and temperature at Chek Lap Kok rose to a high of 22.9oC at around 0642UTC, almost 6 degrees above the sea temperature.
Winds near the surface at Chek Lap Kok were easterlies around 10 kt throughout the morning. At around 0730UTC, winds at R1W veered to westerlies with the advance of the sea breezes (Fig. 4). The sea breezes slowly advanced across Chek Lap Kok and winds at R1C and R1E veered to westerlies at 0910UTC and 1010UTC respectively. However, the westerlies were short-lived and winds all backed to easterlies by around 12UTC.
The events in Table 1 could be grouped into 2 separate episodes, the first around 07UTC when the westerlies were advancing across the airport and the second around 13UTC when the westerlies were retreating. Figure 5 shows the head wind recorded by five flights representative of those flights in the first episode. They all encountered an increase in head wind of around 10-15 kt in the last 100 feet before touchdown. The variation of head wind with height for two flights landing at around 13UTC is given in Figure 6. Based on the head wind measured on board, the lifting shear experienced by these two flights in the last 100-200 ft was less than 10 kt.
As 22 January 1999 was a fine day, the signal returns captured by the Terminal Doppler Weather Radar (TDWR) were too weak and the westerlies were too shallow for any windshear event to be detected using TDWR data. A windshear alert had been issued following receipt of aircraft report.
Although the runway anemometers did detect the arrival of sea breezes at Chek Lap Kok, windshear could not be recognized when the convergence zone was to the immediate west of the airport. Chek Lap Kok is surrounded by waters from three sides, installation of anemometers to the west of Chek Lap Kok is difficult if not at all impossible. The lack of sensing equipment to effectively monitor the sea breezes renders the detection of windshear induced by sea breezes a hard job. It is hoped that the LIDAR in planning would provide some useful data in tackling the problem.
Table 1 Windshear Reports for 22 January 1999
|
Time (UTC) |
Intensity (kt) |
Location (ft) |
|---|---|---|
|
0555 |
10 15 |
on final approach |
|
0657 |
Significant |
on final approach |
|
0700 |
20 |
on final approach |
|
0740 |
-15 |
on final approach |
|
0957 |
-10 |
on final approach |
|
1234 |
10 15 |
100 |
|
1304 |
15 |
200 |
|
1308 |
15 |
200 |
|
1312 |
10 15 |
100 |
 |
 |
| Fig. 4 Runway winds at 0740UTC | Fig. 5 Head wind vs. height recorded by five flights landing between 0520UTC and 0644UTC |
Fig. 6 Head wind vs. height recorded by two flights landing around 13UTC
Intensive Windshear and Turbulence Reporting Exercise (1-31 March 2000)
The Intensive Windshear and Turbulence Reporting Exercise was successfully conducted from 1 to 31 March 2000. We received tremendous number of windshear reports during the exercise period and we are now in the process of studying these reports in detail. The opportunity is taken to express our sincere thanks to all participating government departments and airlines.
Radar Images of Heavy Rain on 3 April 2000
Heavy rain and severe thunderstorms affected Hong Kong in the small hours of 3 April 2000 when an active trough of low pressure swept across the coast of Guangdong. The Red rainstorm warning and aerodrome warning on thunderstorms were issued. Figure 7 depicts a radar image of rain echoes at 3 km above ground level taken from the weather radar at Tai Mo Shan at 3 a.m. It revealed a broad band of rain lying across the territory with intense rain echoes (in yellow and red) covering Chek Lap Kok and the New Territories. In Figure 8, a vertical cross-section of the intense rain echoes to the immediate west of Chek Lap Kok (corresponding to a vertical cut from point A to point B in Figure 7) indicates that the rainstorm extended to as high as 14 km above the ground level. The rainstorm had rainfall rates in excess of 100 mm/h (in red and purple). Chek Lap Kok received 35 mm of rain in a single hour, from 3 to 4 a.m.
The Hong Kong Observatory to procure a LIght Detection And Ranging (LIDAR) system to supplement its windshear and turbulence warning service
The Hong Kong Observatory plans to enhance its windshear and turbulence warning service by implementing a LIDAR system for the HKIA at Chek Lap Kok. A LIDAR uses infrared radiation (wavelength of about 2/10,000 cm) to detect movement of aerosols and derive the wind speed and windshear. Its working principle is the same as the TDWR, except that the TDWR utilizes microwave (wavelength of about 5 cm) to detect movement of raindrops and computes the wind speed (Fig. 9). A LIDAR works best under fine weather conditions, whereas the TDWR is suitable for detecting windshear in rainy weather.
The existing warning service utilizes data from the TDWR and anemometers to detect windshear. A LIDAR had in fact been deployed in experiments in the mid-90s by consultants. However, at that time LIDAR was still very much a research tool, and a reliable and operational system was not yet available in the market. In the past couple of years, LIDAR technology has become mature and more reliable systems are now available in the market. The LIDAR system for Chek Lap Kok is scheduled for installation in 2002 and is expected to further enhance our windshear and turbulence warning capability.
Fig. 9 Difference in operation of weather radar and LIDAR
Aviation Weather Services on the Net
Work is in hand to develop within the HKO internet homepage a section on "aviation weather services". Initially, the information will include: weather observations at the airport, forecasts for local aviation, climatology of the HKIA, as well as a virtual tour of the HKO's aviation weather facilities, both in the airfield and farther away on hilltops and remote places. There will also be a brief description of the different types of services provided by the HKO. We expect this internet service can be on-line later this year. Subject to user feedback, we will put in more information as necessary.
Wind Power as Alternative Energy
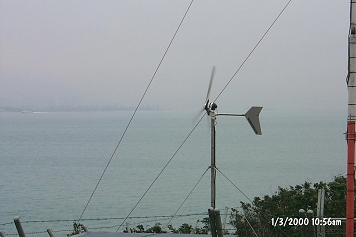
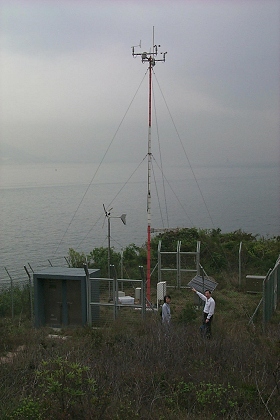
Since the 1980s the HKO has been utilizing solar power at automatic weather stations (AWSes) at hilltops and remote islands, where there is no city power. While the reliability of solar panels is high, prolonged overcast conditions and rainy weather lead to little or insufficient solar energy, rendering these stations inoperative. Early this year, we experimented with wind energy at the Sha Chau AWS. There we installed a wind turbine with a rotor radius of one metre (Fig. 10 & 11). The device is relatively low-cost and environmentally friendly. Initial results are very encouraging. The wind turbine and the solar panels join hands to form a dual-power source, significantly enhancing the overall reliability of the station. It is our plan to install a few more wind turbines in other remote AWSes later this year.
|
|
| Fig. 10 The wind turbine at the Sha Chau AWS | Fig. 11 A solar & wind powered automatic weather station |
Telephone and Fax Numbers
Telephone :
Officer-in-charge AMO
(852) 2910 6300
(852) 2922 5805
Duty Forecaster AMO
(852) 2910 6920
(852) 2922 5806
Enquiry on flight documents
(852) 2910 6921
Fax :
(852) 2910 0080
Correspondence
We welcome comments and suggestions on our aviation meteorological services. Please send them to the following address:
Director of the Hong Kong Observatory
134A Nathan Road
Kowloon, Hong Kong
(Attn.: Officer-in-charge, Airport Meteorological Office)