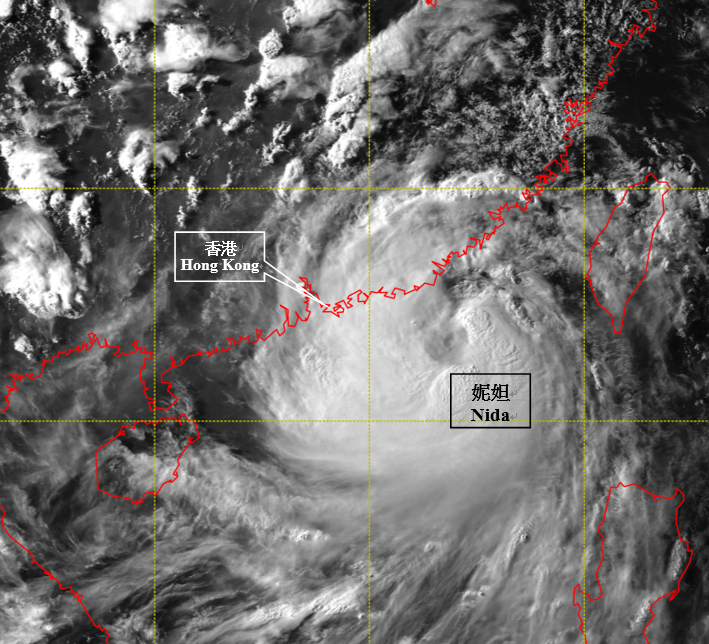
Figure 3.3.6 Visible satellite imagery around 5 p.m. on 1 August 2016, when Nida was at peak intensity with estimated maximum sustained winds of 130 km/h near its centre.
[The satellite imagery was originally captured by the Himawari-8 Satellite (H-8) of Japan Meteorological Agency (JMA).]