TROPICAL CYCLONES IN 2016

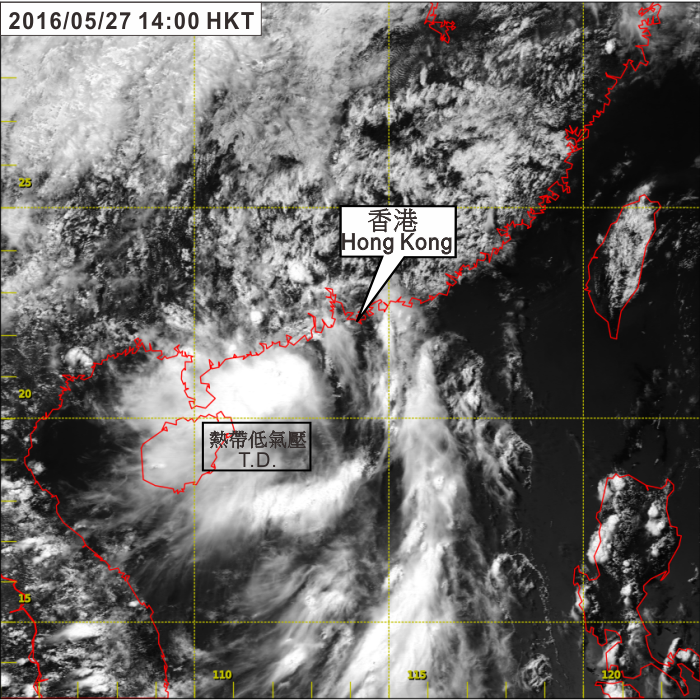
Figure 3.1.3 Visible satellite imagery at 2:00 p.m. on 27 May 2016 as the tropical depression reached its peak intensity with estimated maximum sustained winds of 55 km/h near its centre. [The satellite imagery was originally captured by the Himawari-8 Satellite (H-8) of Japan Meteorological Agency (JMA).] |