Skip Content
Report on Tropical Depression (25 to 26 June)
Report on the tropical depression (25 to 26 June)
Figures
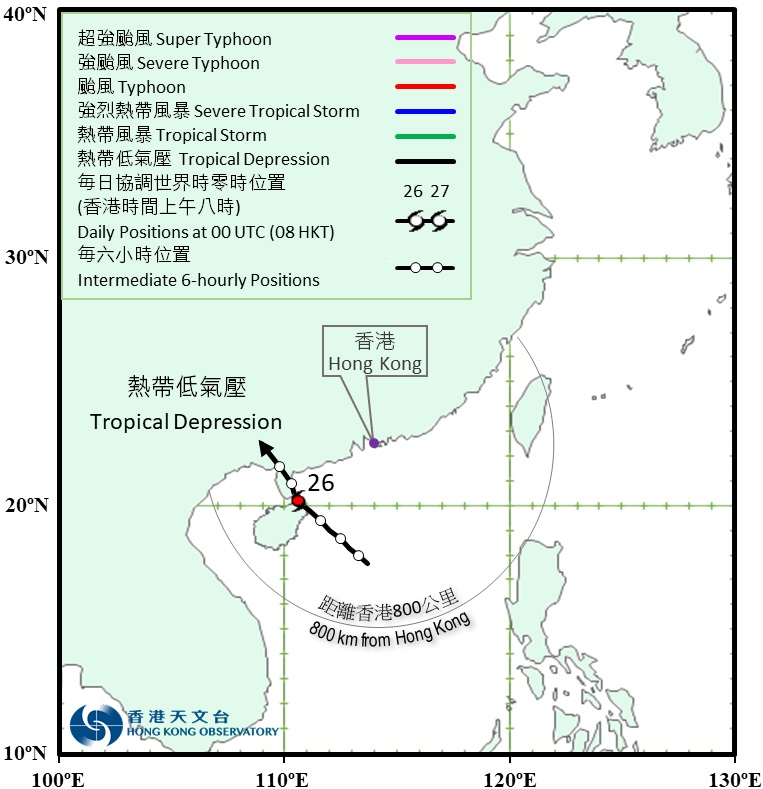
Figure 1: Provisional track of the tropical depression: 25 - 26 June 2025
Figure 2: Rainfall distribution on 25 – 26 June 2025
Figure 3: Infra-red satellite imagery at around 5 p.m. on 26 June 2025
Tables
Table 1: Maximum gust peak speeds and maximum hourly mean winds with associated wind directions recorded at various stations when the tropical cyclone warning signals for the tropical depression were in force
Table 2: Daily rainfall amounts recorded at the Hong Kong Observatory Headquarters and other stations during the passage of the tropical depression
Table 3: Times and heights of the maximum sea level and the maximum storm surge recorded at tide stations in Hong Kong during the passage of the tropical depression